Friday, May 29, 2009

Hongkong Land - Potential correction at key gap zone resistance level

- After rallying by more than 32% over the last 2 weeks, Hongkong Land is showing signs of fatigue with the formation of a spinning top and doji candlestick just shy of the key gap zone resistance level at US$3.43.

- With the RSI showing signs of falling out of the overbought region and the ROC indicator signaling a sharp bearish reversal high up in the positive territory, they seem to suggest that the uptrend momentum is waning and correction may be inevitable.

- We expect the stock to find initial support at US$3.20-US$3.25 (minor gap in Sep ‘08), breaking which, we see the next support at US$2.86 (resistance-turned-support level and 3-month uptrend line)

- Immediate resistance is pegged at US$3.70 (support-turned-resistance level), ahead of $3.93 (support-turned-resistance level).

Sponsored Links

Hyflux - Ascending triangle breakout suggests potential upside


Hyflux could be poised for more upside in the weeks ahead after breaking above the top boundary of its 6-month ascending triangle. It has also closed above the $2.00 key level (last seen in early Oct ’08) on heavy volume in yesterday’s trading session.

- The RSI has rebounded sharply off its 2.5-month uptrend line and MACD has made a bullish crossover after rebounding off its 6-month uptrend line; both suggesting a strong uptrend momentum. However, on a cautious note, we advocate waiting for a successful retest of this resistance-turned-support level which should further serve as confirmation of the breakout.

- Immediate support is pegged at $1.72 (recent troughs in Apr ’09 – May ‘09), ahead of $1.56 (gap zone in Mar ’09 and bottom boundary of ascending triangle).

- Should the breakout materialize, we expect an initial resistance at $2.40(key gap zone in early Oct ‘08), breaking which, we see the next resistance at $2.91 (Sep ’08 high and ascending triangle breakout theoretical price target).

Olam flag formation


Chart for Olam=$1.90 (Flag Formation...resistance at $2.18)

Thursday, May 28, 2009

Last wave for Yanlord


Yanlord=$1.98 (Should be in the last wave already..ready to sell)

CapitaRChina going higher?


CapitaRChina=$1.10 (Going for the second target)

Cosco need more volumn to get higher


CoscoCorp=$1.21 (Going for 200DMA at $1.39? need more volume)

Can Straits Times Index New High go higher?


The STI has also been trading sideways since the beginning of May09. It has tested the 2270 to 2283 level several times since, making higher lows each time.

As a result, the range that the STI has been trading in over May09 has been getting increasingly narrow. This can be seen on the chart where price action has been confined between the 2283 level and the trendline. The tightening of the trading range in such a manner usually indicates that the STI is going to breakout.

Yesterday, we saw the STI breakout of the range to trade above 2283. The push above 2283 should be the beginning of another leg up. We would like to see the other indices close above their recent highs as well. This would confirm that momentum is picking up in equities as an asset class and that the STI is not running up alone.

There is resistance at 2385 and subsequently in the 2450 to 2500 region. A word of caution at this point though. Although the STI has cleared 2283 as of yesterday’s close, the RSI is showing a potential momentum divergence setting up. It would be bearish for the STI should the next few days see a downdraft, as this would confirm that the momentum divergence is in play and this breakout is a head fake.

Is Nikkei turning bullish?


NIKKEI 225 INDEX (50DMA cut 100DMA....may be it is trying its 200DMA soon). The World 2nd Largets economy turning bullish? We shall wait for the 200DMA
to be tested first.

Wednesday, May 27, 2009

DBS - Technically a buy crossed 200-day moving average on 5th May


We have a technical BUY on DBS with a target price 13.84. Based on wave counts, we believe that the last impulsive is in the making. Volume showed that there are signs of buying interests. In addition, a crossover of 200-day moving average provides a strong support. If the breakout of 12.42 does not occur, DBS is expected to consolidate within the range of 10.88 and 12.42.

DBS crossed 200-day moving average on 5th May and tested the recent peak of 12.42 three days later. RSI is trading at bullish range.

We believe that the second corrective wave ended at 14th May 2009 and last impulsive wave is in the making before a bigger correction.

The crossover of RSI marked the end of the minor correction from 12.42 to 10.88. Volume showed signs of increasing buying activities. Time cycle analysis tells us the minor correction has ended and a new cycle has just begun. If the convincing breakout of 12.42 does not occur, though unlikely, we believe DBS would continue to consolidate within the range of 10.88 and 12.42.

StarHub - Positive breakout suggests more potential upside


StarHub could be poised for further upside in the medium term after breaking out above the upper boundary resistance line of its 5.5-month downtrend channel on heavy volume in Friday’s trading session.

However, with both the RSI and stochastic indicators currently showing overbought signals, StarHub could stage a pullback in the near term; this possibly to retest the resistance-turned-support line, which should serve a confirmation of the breakout.

As such, immediate support is pegged at $2.10 (resistance-turned-support upper boundary channel line), ahead of $2.03 (resistance-turned support level).

For the subsequent rebound, we expect an initial resistance at $2.36 (Nov ’08 high and channel breakout price target), breaking which, we see the next resistance at $2.51 (support-turned-resistance level)

What if Dow go above 200DMA and how about STI?


DJ INDU AVERAGE (Surprise may be on the upside if DJIA going for 200DMA)


After a 1.3% loss yesterday, the STI rebounded strongly, taking cue from the strong overnight US market close to rally past its recent 2009 high of 2283 at midday close. Should the index close convincingly above this key resistance level, we could see more upside recovery in the days ahead.

Bear turning a bull - up CPO price expectation

We are less bullish on demand especially on the sustainability of Indian buying momentum in 2H09.

On the supply outlook is in line with our expectation, especially the palm oil supply from Malaysia. Also we have highlighted that the weaker than expected 1Q production reported by most of the Indonesian plantation companies is an indication of potential downwards revision on Indonesia total production.

We are still bullish on the sector, but we think that the rally on CPO price unlikely to sustain as the current high price might deter buying and also we also concern on the rising foreign participations in Bursa commodity exchange. The last we see the surge in foreign participation was in 2H07 till Mid-08, which we saw the highest volatility to CPO price.

For 2H09, we are expecting CPO to trade lower with an average of RM2, 200/tonne (vs our previous expectation of RM1,800/tonne and 1Q09 average: RM1,918/tonne).

Our top pick: Wilmar (WIL SP) as sector leader and its information and network advantage enable Wilmar's to deliver a better than industry profit margins.

For mid-cap prefer Singapore and Indonesia listed companies as valuation are less demanding. Our picks: Indofood Agri (IFAR SP) and Sampoerna Agro (SGRO IJ).

For exposure to Malaysia, our picks are KL Kepong (KLK MK) and Asiatic (ASP MK).

Tuesday, May 26, 2009

Celestial Nutrifoods - Bearish shooting star pattern suggests more near term downside


- Celestial Nutrifoods is likely to face further correction pressure in the nearterm following the formation of a bearish shooting star pattern just underthe 1-year downtrend line and key support-turned-resistance level.

- With the RSI and Stochastic indicators on the verge of falling out of theoverbought region, coupled with bearish divergence signals generated withreference to the price action over the last month, this seems to suggestthat there could be more room for correction in the days ahead.

- We expect the correction to find an initial support at $0.195 (resistance-turned-support level), failing which, we see the next support at $0.165 (2-month uptrend support line)

- Immediate resistance is pegged at $0.275 (key support-turned-resistancelevel), ahead of $0.345 (support-turned-resistance level).

Biosensor - take profit


Biosensors=$0.55 (Ready to take profit at our first target $0.58)

ChinaMilk pending breakout?


ChinaMilk=$0.51 (Bull Flag formation pending breakout?)

F&N get ready to sell


F & N=$4.24 (Coming to target at $4.34...get ready to sell)

Monday, May 25, 2009

BDI will likely reverse on lower iron ore imports and easing port congestion

China's iron ore imports have been rising sharply in the last 3 months (Apr 09: +33% yoy to 57mt) despite its sluggish crude steel production growth (Apr 09: -2.8% to 43mt). This was mainly because traders were stockpiling iron ore in anticipation that prices would rise, according to the China Iron and Steel Association (CISA). This has led to a near record high iron inventory of 70mt, resulting in many ore carriers congested at the Chinese ports. Figure 3 shows rising Capesize tonnage waiting at Chinese ports.

The Baltic Dry Index (BDI) has risen 250% ytd to 2,707 from a extremely depressed level due to 3 reasons a) some easing in trade financing, b) high iron ore cargo shipments in the past 3 months, and c) the port congestion in turn soaks up more vessel capacity, boosting spot freight rates.We expect China's iron ore imports to ease, which in turn will ease port congestion. This will have a double-whammy impact on spot freight rates.

The BDI breakeven level for most dry bulk shipping companies is about 2500. At the current BDI level of 2,707, the profit level remains low for most companies. They will likely make losses in spot trades when the BDI reverses. The China's Ministry of Industry and Information Technology has issued a circular to authorities to control the number of steel traders and to crackdown on stockpiling.

We believe the current rally in BDI is not sustainable and will likely come off. We recommend selling dry bulk shipping stocks into strength. They have had a good run in the current stock market and BDI rallies. We remain UNDERWEIGHT on the dry bulk shipping sector in view of alarge influx of newbuilds into the market from 2H09 onwards.

Midas breakout from flag


MIDAS=$0.65 (Breakout from Flag)

China Hongx - Breakdown support


China Hongx=$0.185 (Breakdown support at $0.19, target $0.16)

F&N - Potential correction at key resistance level


- After rallying by more than 66% over the last 3 weeks, F&N is showing signs of fatigue with the formation of a tweezers top just shy of the 1.5-year downtrend line and key support-turned-resistance level in Aug-Sep ’08.

- With the technical indicators (RSI and Stochastic) showing signs of turning down inside their respective overbought regions and the ROC indicator signaling a bearish crossover recently, they suggest that the uptrend momentum is waning and correction may be imminent.

- We expect the stock to find initial support at $3.45-$3.50 (minor gap in mid May ‘09), breaking which, we see the next support at $3.00 (200-day MA and resistance-turned-support level)

- Immediate resistance is pegged at $4.38 (minor peaks in Aug-Sep ’08), ahead of $4.65 (support-turned-resistance level in Jun ‘08).

SembCorp Industries - Bullish harami pattern suggests more near term upside

- SembCorp Industries is likely to see more upside potential in the near term following the formation of a bullish harami pattern at its 2-month uptrend line.

- With the technical indicators (RSI, Stochastic and MACD) showing healthy uptrend momentum over the past few months and OBV indicator signaling a sharp bullish reversal recently, they suggest that SembCorp could continue to climb higher in the days ahead.

- We expect the recovery to find an initial resistance at $3.33 (2009 high), breaking which, we see the next resistance at $3.74 (minor peak in end Sep ‘08)

- Immediate support is pegged at $2.80 (resistance-turned-support level), ahead of $2.60 (resistance-turned-support level).

Friday, May 22, 2009

FSSTI in final leg of wave 3; expect resistance near 2,330-2,350

The previous steep rally in the FSSTI was a wave iii of 3 move, which most often is the most dynamic move. The pullback from that level saw the index retracing exactly 38% of the preceding move, which is a key fibonacci retracement level of the move. The present move is the final leg of wave 3, which should terminate near 2,330-2,350. This should be followed by a steep pullback.

What to expect:
a) at least one more gap up in the index.
b) lower volume compared to wave iii of 3.
c) divergence on RSI and MACD as the index breaks above the previous high of 2,284.
d) lower market breadth compared to previous wave iii.

We are already seeing second liners rallying sharply. Second-liner property stocks have rallied while previous leaders have stalled. Wave v of 3 should see a broad-based rally but with breadth lower than that of wave iii. We recommend quick trades on City Developments at S$8.20 (Target: S$8.70), SGX at S$7.20 (Target: S$7.80), Wing Tai at S$1.27 (Target: S$1.45) Yangzijang at S$0.745 (Target: S$0.82-0.84, see last week’s report), and Straits Asia at S$1.41 (Target: S$1.80)

Crude oil future broke above


Crude oil futures have broken above the 23.6% Fibonacci retracement level yesterday on bigger than expected drops in U.S. crude inventories and commencement of the summer driving season which officially begins May 25. The FR breakout paves the way for $68, which is the double bottom target.

BDI might test 200-day EMA


Based on current trajectory, good chance the Baltic Dry Index might test its 200-day EMA soon. This development could lead to positive sentiment spilling over to STX PO, Courage Marine and Mercator Line.

Thursday, May 21, 2009

SSE A SHARE IDX has almost reached our target


Two days ago, Shanghai A hit a high of 2,821 almost reaching our technical target at 2,831.
There is a Bearish Divergent on the MACD (lower crossover when index hit new highs).
Technical speaking, Shanghai could has already reached a turning point in this rally.

Oceanus - gap covered - sell


Oceanus=$0.295 (Gap at $0.30-0.305 covered, sell)

This rally in Singapore has legs

Raised earnings by 3%(09F) and 4%(10F). 1Q09 earnings report card came in largely in line, with more companies surprising on the upside than downside. Net earnings fell 23% yoy but up 44% qoq. Significant upgrades of earnings in telcos, plantation stocks more than offset downgrades in consumer services, Basic Materials, Real Estate and Industrials, resulting in a net increase of 3% (09F) and 4% (10F).

Recovery trades have a long way to go – raising 12-month target for STI to 2800. A combination of low valuations, higher risk appetite of investors and a liquidity driven rally has pushed the STI past our target of 2,150 since we made a positive call on the Singapore market at end March. We believe the worst is over for the Singapore economy and the market could re-rate to mid cycle PER as the economy progressively recovers. If we apply a target PER of 16x, which is the historical average PER on FY09 earnings, our near term target could hit 2400. Applying a potential earnings growth of 15% growth for next year, the STI could reach 2,865 without stretching valuations to extreme levels.

Early cyclical recovery plays still in vogue. We believe the theme on early cyclical recovery plays has yet to fully run its course, given that the economy is still in the midst of ‘bottoming out’. We would go for laggards within these sectors – our preference for Capitaland over City Development based on potential upside in the property sector, UOB over OCBC for Financials. Wilmar is our top pick, as we expect the potential listing of its China subsidiaries to unlock value for shareholders. We have picked SGX as a proxy to our positive stance on the equities market and SIA Engineering, which will lead the recovery in the aviation sector.

Don’t forget the small caps. Despite the recent surge, valuation gap between the small and large caps has maintained, with the small/mid cap stocks trading at 9.8x(FY09F) and 9.1x(10F).

Our small/mid cap picks are resource-based stocks benefiting from the firm oil/coal/commodity prices (Swissco, SAR, First Resources) or value buys (Ho BEE, and Fraser Centrepoint Trust) trading at a discount to book value.

Comfort Delgro’s PE differential with the MSCI Singapore Index has fallen to an extreme

Shares of Comfort Delgro (Buy, TP: $1.55) have been flat since February as investors preferred recovery to defensive plays but we think its time to consider accumulating the stock because the stock’s PE differential with the MSCI Singapore Index has fallen to an extreme (refer to chart 1). Based on historical behavior, the stock should start to narrow down this PE differential. At the very least, the stock should start to participate in the market’s rising trend. At the same time, if the market corrects, there will also be a flow back to defensives – a win-win situation.

Tat Hong riding on construction boom?

With a possible bottoming out of this recession and abating risk aversion, growth prospects for the construction sector remain the most optimistic, given a slew of infrastructure projects initiated by regional governments, including Singapore. Falling prices of construction materials have also eased margin pressures.

Dissecting Tat Hong based on technical analysis, the stock looks to have bottomed out and resuming uptrend on weekly and daily chart. Despite the market going through a correction today, Tat Hong is holding up well and up 6.8% @ 1.09 now (11.30am). On the medium term outlook, I am bullish that it might hit a target price of 1.40. As for trading strategy, I think it will be good opportunity to buy more on pullback on the daily chart.

Wednesday, May 20, 2009

Technically buy Venture


Yesterday’s close for Venture was strong, closing at the high of the day at S$6.78. Venture pulled back upon testing resistance at S$7.14, indicating that selling/profit taking came into the market. The strong close near the highs yesterday tells us that selling is probably done and buying is coming in.

Similar to SPC, stochastics has generally been overbought and is only dippingslightly to the 70 region. We interpret this as a sign that momentum is still strong. Initial resistance is at S$7.28, the recent high. Then S$8.34, S$8.80 and S$10.00. We recommend taking at least half of profits at S$8.34 and trailing stops tightly. The $10.00 mark is far away and there is only a modest probability of it being hit. Trailing stops will allow investors to take as much as the market offers while taking profit at S$8.34 locks in a healthy amount of profit in the mean time.

Recommended stop loss is at S$6.30. But with now HP reports lower than expected results last night, not too sure now.

Technically buy SPC


Despite the pullback in the STI, SPC has only consolidated and barely declined. Thus, SPC has strong relative strength vis-à-vis the STI.

We have mentioned that stochastics can remain oversold for prolonged periods of time when the trend is strong and SPC has done just this. In this case, overbought stochastics is actually an indication of strength rather than the typical bearish implications that an overbought reading has.

There is resistance at S$4.78, however, upon clearing S$4.78, the next key resistance is at S$5.82 which is a good amount of upside. Recommended stop is at S$4.00.

STI is running out of steam?


Straits Times Index (Running out of steam?... Should sell and go for holiday....)

Midas break out trendline?


MIDAS=$0.66 (Breakout the trendline)

Tuesday, May 19, 2009

STI flag formation?


Straits Times Index (Flag formation?)

With earnings season over, we believe any further action is likely to be driven by corporate developments - from our recent interactions with the companies, there seems to be some renewed interest in M&As, although overall funding may still be an issue.

Beyond 2200, the next cap is 2283 (intraday high for 2009), while the key resistance can be found at 2391 (38.2% Fibonacci retracement of the plunge from 3906 to 1455).

Meanwhile, we see the initial support at 2100, ahead of 2033 (23.6% Fibonacci retracement resistance-turned-support).

Next Resistance level: 2390 (38.2% Fibonacci retracement)
Immediate Resistance level: 2200 (Psychological resistance)
STI Current: 2172.92 (Last close: +1.6%)
Immediate Support Level: 2100 (Psychological support)
Next Support Level: 2033 (23.6% Fibonacci level)

DMX first target reached - take profit


DMX Tech=$0.175 (First target reached ...take profit)

Hourly Chart for ChinaAniH


Legg Maison took up 80mln placement shares at $0.11 and they bot 9.3mln at $0.147 in open market.

Oceanus get ready to sell


Oceanus = $0.285 (Get ready to sell tomorrow when hit $0.30)

Monday, May 18, 2009

Singtel holding well


SingTel=$2.92, Above 200DMA, target =$2.80+($2.86-2.56)=$3.10

STI wait for further decline


Straits Times Index = 2,125 (support still seen at 2,046...wait for further decline)

Genting - a sharp correction coming


Genting SP, with the annoucement of quarter loss, correct coming...a sharp one next week!

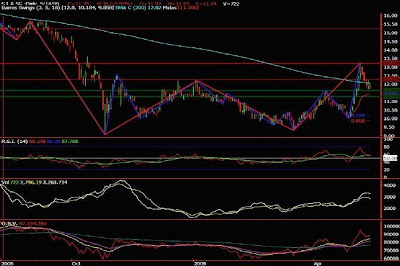
SIA - technically buy?


SIA has been battled badly due to swine flu. However, we thinkthe support level at 11.60 is a strong one while no major resistances exist. The risk-to-reward is in favor to accumulate the stock at this moment. We have a technical BUY of 12.28.

Over the past few days, SIA has underperformed the STI index considerably due mainly to the fear of the negative impacts brought by swine flu on aviation sector. The flu alert in Singapore was lowered, but SIA continues to trade lower.
SIA has retraced almost 50% of the recent upswing (from 9.30 to 13.22).

We believe the support at 11.60 is a strong one, as evidenced by the confluence of support level defined by the peak on 9th April 2009 and the Fibonacci retracement.


RSI attempts to cross its corresponding 14-period moving average. The declining momentum has slowed down and signifies that a change in trend is about to ensue.

Interaction between volume and share price reflects the psychology of mass investors. The moving average of the volume shown in rectangle resembles a bell curve, a typical cycle for a buying interest. The decline in SIA was not coupled with strong selling pressure, indicating most investors are not dumping the share.

Buying interest will be easy to form at this juncture. We just need a few innovators to initiate a buying wave, the strong upswing will follow.

We think the entry risk is low given that SIA is trading near to MIDAS.

If the support of 11.60 to be broken convincingly, albeit unlikely, a continuation of the current downtrend may occur.

Friday, May 15, 2009

ChinaZaino - another breakout S-Chips


ChinaZaino, once the resistance at 0.27-0.28 taken out, may go to $0.33.

Dow and STI - Bear is coming to town?


DJ INDU AVERAGE, fell below the greenline night before, further pullback to 8,070 yellowline is possible. By the way, US market is below 200DMA (8,923) unlike Asia markets, US markets is still in a Bear market territory. So for STI, you may see it is being channeled downward.

IndoAgri - Bullish Flag


IndoAgri = $1.24 (Bullish Flag), but STI appears to be weak, so...

Thursday, May 14, 2009

Sino-Env the only green among all the red


Sino-Env = $0.155 (Breakup yellowline....resistance at $0.20)

CityDev – Look for pullback to $7.63

After a decent run, we foresee some price weakness ahead for CityDev as suggested by the MACD Diff trend. On charts, CityDev has established a trading range between $7.63 and $8.63; the lower boundary also coincides with CityDev’s consensus RNAV of $7.60. We need to first see if $7.63 will hold; on the scenario that it fails, expect more downside on CityDev as gap covering will occur.

Trading Idea: 1Q09 results (net profit $83m) were below consensus of $100- 110m. CDL saw weaknesses in the hotel division (via M&C) and residential developments, which was partially offset by higher rental income from commercial properties. On valuation, stock has risen by more than 100% from March lows of $4.05 and appears overbought in the short term. Barring further uplift in prices in the physical market, we expect stock to pull back. We remain buyers of the stock below $7.60.

S&P500 Continue rally or ....


While many question the sustainability of the recent rally, we believe it is far from over. Small correction may occur with a first support at 879, accumulate on weakness. In addition, volume of the index shows no sign of weakness in accumulation. Our target for S&P 500 is 941.
S&P 500 has recorded the longest streak of weekly gain ever since the peak at Oct 2007. There were 8 gains out of 9 weeks since the recent record low 667 in early March.

The buyers outnumbered sellers considerably as evidenced by the crossover of channel in late April (yellow circle).

Unlike Hang Seng Index, Nasdaq and STI, the retracement of 38.2% is yet to be witnessed. Although its rally lags most of the regional indexes, we believe it is just a matter of time for 38.2% retracement.

Wednesday, May 13, 2009

DMX another 200MA stock?


DMX Tech=$0.145 (Another 200Day Stock, First Target=$0.175)

Yanlord sky rocket to 3rd target


Yanlord=1.78 (Going for 3rd Target)

China XLX breakout maintained


China XLX=$0.455 (Breakout $0.45 went to $0.47 and threw back to $0.44 again...target maintain)

China Zaino blug flag gap covered


ChinaZaino=$0.265 (Called when it brokeout Bullflag, gap at $0.27-0.28 likely to covered)

Tuesday, May 12, 2009

STI wait for pull back - hope so


Straits Times Index (Pending pullback....stay clear...)

The STI opened lower this morning on profit-taking, which was not surprising, given the formation of a bearish candlestick on Friday; coupled with yesterday's lower close, it seems like the index could be due for some correction.


While the STI did manage to briefly climb into the positive territory midway through the morning, the selling pressure was just too strong; this was well reflected by the intraday MACD indicator.

But with the intraday RSI indicator looking somewhat oversold, the correction could moderate in the afternoon, and help the index stay above the 2100 support.

Midas to rebound?


Hourly Chart for MIDAS show it is goign to rebound. Hit SRA at $0.62, Take profit.

Monday, May 11, 2009

HTF formation - Biosensors


Biosensors=$0.505 (HTF Formation...)

Asia-Env - ready to sell


Asia Env=$0.175 (Ready to fill the gap...get ready to sell)

STI break long term trendline resistance 2200 last week


Straits Times Index=2,201 (Pulling back is unavoidable..200DMA at 2,031 should hold). The FSSTI has broken past an important resistance long-term trendline resistance near 2,200 last week. Pullbacks have been equally shallow. While there is so noticeable pause in upward momentum on index stocks, we do not see the risk of a steep sell down as yet. Since late last week, market volume is dominated by small-cap stocks. The ranges of some of these stocks have expanded more than 50% above the typical 3 -5 day average ranges. This suggests growing confidence in small caps.