Friday, September 18, 2009

Singapore Strategy - Re-jigging top picks

Usual caution towards September unwarranted? Since late August, there has been a growing perception that equities have become overbought. Various strategists have sounded caution. Warning shots like the sell-down of the Chinese stock market last week plus noises about a new interest rate tightening cycle have emerged as new negatives by early September. This, coupled with September’s infamous track record for stock-market disappointments, added to the caution. All the above concerns are valid, though they have to be balanced by the sense that there seems to be still a tremendous amount of un-invested money on the sidelines. Trading into the second week of September, high-yield stocks like SPH, M1 and the REITs have outperformed, indicating a chase for yields and still-high levels of liquidity. Market price actions make us reconsider our defensive posture: one might miss the next rally if one stays defensive for too long.

Maintain Overweight on Singapore; CY09 index target remains 2,700. We leave our 2,700 year-end FSSTI target unchanged for now though it is useful to start thinking about final index target peaks. From our study, the FSSTI peaked at 2.3- 2.4x P/BV in the last two recovery cycles. Simplistically extrapolating such P/BV peaks would imply FSSTI targets of 3,900-4,000 at the end of this bull cycle. This might be a tad too bullish as prospects for bank, property and O&M earnings were much stronger two years ago. The FSSTI peaked above 2.0x P/BV only in periods of extreme exuberance (2000 tech boom and 2007 property boom). Assuming it does not reach 2.3-2.4x P/BV and eventually peaks at 2.0x P/BV, we see a target of 3,350 for next year, when we would turn bearish. Using a mean 16x P/E would also suggest a FSSTI target of 3,400.

Sector thoughts and top picks. From our list of top picks in August, we would take profit on CDL-HT and Ho Bee, replacing them with PLife REIT and Keppel Land. Other picks such as CityDev, Indofood Agri, Noble, SembCorp Industries, SPH, Suntec REIT and UOB remain. Additionally, CSE Global and Ezra have been added to our preferred list. Among the sectors, we suggest going long on property and short on banks. We prefer interest-rate-sensitive sectors to banks. Conglomerates stand out as a non-consensus Overweight, though the brighter prospects in the sector belong to second-tier names for now, we believe.

Sponsored Links

Thursday, September 17, 2009

Dry Bulk Shipping - Bi-weekly: BDI correction, near-term rebound

The BDI declined for 10 consecutive days due to weaker iron ore trade as well as seasonality, and it has already stabilised. We expected near-term rebound. Reiterate UNDERWEIGHT.

BDI’s correction due to seasonality. The Baltic Dry Index (BDI) declined by 18% over the past two weeks, mainly due to seasonality. Weak coal demand, quiet grain trade, and fewer chartered-in activities from Australian iron ore miners caused BDI to fall for 10 consecutive days. Rates stabilised later in the week ended 14 August.

Capesize. Fewer chartered-in activities from iron ore miners hence eased ports congestions in China, Brazil and Australia dragged down the Capesize rate. Average earnings fell by 2.5% wow to US$42,972/day.

Panamax. Panamax rate recorded a bigger decline than Capesize due to quiet grain exports from Latin America, weaker global demand for coal, and China’s decrease iron ore import from India. Average earnings fell by 0.6% wow to US$15,390/day.

Handymax/Handysize. Dragged down by Capesize and Panamax rates as well as fewer enquiries, average earnings of Handymax fell by 11.9% wow to US$17,625/day.

We expected a rebound in BDI in the near term after an 18% decline in two weeks. We see strong production of small steel mills in China and a global recovery in grains and other minor bulk trades helping the rates to rebound in the next two weeks. In the longer term, we maintain our conservative view with a BDI forecast of 2,500 for 2009 based on our 2009 steel production forecast of 514mt, considering steel inventories are building up and steel prices are showing signs of weakness.

Rise in iron ore stockpiles stops. The continuous rise in Chinese ports’ iron ore inventory was over. On 14 August, the inventory decreased by 1% to 74.55mt, from 75.29mt, still at a high level. Small- to mid-sized steel mills were rapidly resuming production while fewer chartered-in activities from iron ore miners caused the first two weeks of decline in iron ore inventories since the beginning of the year.

In our shipping sector’s 1H09 results preview, we raised the fair price of COSCO (1919.HK/SELL) and China Shipping Development (1138.HK/SELL) to HK$8.50 and HK$10.40, respectively, but maintain SELL rating. We also raised the fair price of Pacific Basin (2343.HK/SELL) and STX Pan Ocean (STX.SP/SELL) to HK$5.80 and S$11.00 respectively in the 2Q09 results update, and maintain SELL rating. We suggest selling expensive dry bulk stocks. COSCO is our top SELL.

Wednesday, September 16, 2009

Bukit Sembawang Estates - Downgrade on valuations


BukitSem, Outside bollinger band...sell. BS's share price has gained over 40% since our upgrade of the stock to Outperform in June. While inherent value remains considerable from its low-cost land bank, a lack of corporate access and relatively low trading volume are concerns. As uncertainties in the sector heighten on the back of cooling measures introduced by the government, we fear that BS will retreat into its shell as the launch window for the year starts to close. We recommend taking some money off the table until further evidence of improvements in the sector. We raise our FY10-12 core EPS estimates by 1.1% on minor adjustments to our launch schedules. We maintain our target price of S$5.02, still based on a 25% discount to our end-CY10 RNAV estimate to account for the shares' low trading liquidity and lack of corporate access. Downgrade from Outperform to Neutral on valuations.

Tuesday, September 15, 2009

Shangahi A Index rebound may end here


On 30 Aug, mentioned that Shangahi A Index at 2,789 could stage a rebound because 50% retracement will be a good support level. Now that it has rebounded to near 3,190 (yellowline)....chances for this rebound to continue is not very high. Expect Shanghai index to consolidate between 2,800-3,200.

Ramba potentially Technical Rebound?


Ramba =0.46 (potentially Technical Rebound)

Global Equity Technicals - One final leg

Our preferred wave count for the S&P500 shows that the index has peaked at 1,039 after the breakdown of its ST uptrend channel support at 1,014 last week. We also retain our downside target of 950, which is the major uptrend channel support. This week, we introduce an alternate wave count, which has a minimum target of 1,045-1,071, similar to our previous upside target. The alternate view would come into play should the 1,039 level be taken out for the S&P500. Asian markets are on course for a final upswing after holding steady above the key support trend line for MAxJ last week. However, the Shanghai Composite Index may have peaked for the medium term after a 5-wave decline from the high. The Shanghai index is currently on its wave-2 rebound to between 3,059 and 3,158.

Monday, September 14, 2009

CDL Hospitality Trust - Time for a breather

CDLHT's current share price of S$1.47 has exceeded its book value per share of S$1.42 while yields of 5.5% are lower than the REIT average of 8.2%. Even though Singapore's tourism indicators continue to improve and we have bullish above-consensus estimates for CDLHT, we believe most of the positives are in its share price and downgrade it to Neutral from Outperform. Our estimates and DDM-based target price of S$1.41 are unchanged. PLife REIT appears a cheaper and safe alternative at 0.8x P/V with forward yields of 6.8%.

Friday, September 11, 2009

Keppel - Bullish breakout suggests more upside potential

Likely more upside ahead. Keppel Corp (KepCorp) could see more upside potential in the days ahead after initiating a bullish breakout from its 1-month flag consolidation pattern on heavy volume yesterday. Incidentally, yesterday’s breakout also took place at its key $7.70 key support (key resistance-turned-support level and lower boundary of 6-month uptrend channel).

Positive signs from indicators. With the RSI rebounding off strongly from the 50% mark and the MACD indicator rebounding off the centerline and initiating a bullish crossover in the process, these seem to suggest a build-up in upside momentum.

Initial resistance zone at $8.45. We expect the stock to advance to the key resistance zone at $8.45 (2009 high), breaking which, the next resistance is at around $9.19 (minor peak in Sep ‘08).

Immediate support at $7.70. Beyond the $7.70 immediate support, we pegged the subsequent supports at $7.00 (resistanceturned- support) and $6.38 (minor troughs in Jun and Jul ‘09).

Note: We currently have a fundamental HOLD rating on KepCorp with $8.20 fair value.

Thursday, September 10, 2009

Oceanus time to take profit


Oceanus=$0.375 (Weighted Average=$0.377...outside bollinger band..time to take profit)

STI +2% over 2700


The continued optimism displayed by the US stocks overnight, coupled with a strong showing by the Nikkei in early morning trading is likely to inspire the STI to climb higher this morning.

We note that the last month's consolidation had resulted in the formation of a symmetrical triangle continuation pattern very similar to the one formed in early Jun'09 - mid Jul '09, which was subsequently followed by a strong bullish breakout to a new 2009 high of 2700. As such, any signs of a strong positive breakout in the days ahead could imply a similar outcome and propel the index towards the key support-turned-resistance level at 2740.

As before, we note that the technical indicators are starting to turn more positive, with the daily RSI rebounding strongly off the 50% mark and the daily MACD indicator on the verge of a bullish crossover.

On the upside, the immediate cap remains at 2681(50% retracement of 3906-1455 plunge), ahead of 2700 (psychological).

We continue to peg the initial support at around 2600 (mid Aug low); below this, the next strong support is at 2521 (mid Aug low).

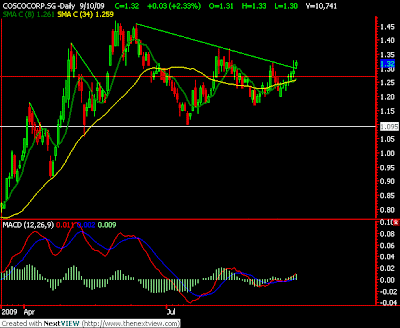
Cosco - Breakout Trendline resistance


CoscoCorp=$1.32 (Breakout Trendline resistance)

Wednesday, September 9, 2009

Epure - More upside potential on positive breakout

Key resistance breached. Epure could be poised for more upside in the weeks ahead after clearing the $0.620 key resistance on heavy volume yesterday; we see this as a significant break given the numerous failed attempts since Mar ’08.

Indicators turning bullish. With the RSI indicator rebounding strongly above the 50% mark and the MACD indicator initiating a bullish crossover yesterday, they support our view that the upside momentum is building up now.

Initial resistance at $0.705. The next resistance is at $0.705 (key support-turned-resistance level and upper boundary of 6-month uptrend channel), ahead of the $0.830 (peaks in Oct ‘07).

Immediate support at $0.620. Below the immediate $0.620 support, we peg the subsequent support at $0.565 (resistanceturned- support), followed by $0.465 (resistance-turned-support).

Oceanus Resistance at 0.355 tested


Oceanus=$0.355 (Resistance at 0.355 tested) MACD crossed over....

Tuesday, September 8, 2009

Dow, S&P500, Nasdaq still bullish

DJIA ? Heading for 2009 high (bullish)
S&P500 ? Heading for 1035 resistance (bullish)
NASDAQ ? Strong rebound at 6-month uptrend line (bullish)

Dow Jones Industrial Average (DJIA) ? Heading for 2009 high

Retesting 2009 high: The index could be heading back up to re-test the 9628 level (2009 high) in the days ahead after rebounding strongly last week.

Bearish divergences: However, with the RSI and MACD indicator still signaling a bearish divergence to the price action in the last 1 month, the 2009 high could prove too strong an obstacle to overcome.

S&P500 ? Heading for 1035 resistance

More upside in the days ahead: After breaking above the key 1000 level, we could see the index heading towards the 1035 resistance in the days ahead.

Warning signs from indicators: However, with both the RSI and MACD indicators showing bearish divergence to the price action currently, the index could potentially be heading for another significant correction if it fails to conquer the 1035 resistance.

NASDAQ ? Strong rebound at 6-month uptrend line

Heading for 2009 high: With the index rebounding strongly from the 6-month uptrend line, we could see further upside in the coming week towards the 2060 resistance (2009 high).

Beware of bearish divergence signals:With both the RSI and MACD indicator already showing bearish divergence to the price action, it pays to be cautious as the index look to re-test the 2009 in the days ahead.

Monday, September 7, 2009

Will Biosensors breakout?


Biosensors=0.60 (About to breakout?)

Asia Indices

Nikkei 225 ? Hovering at key support (bearish)
SSEC ? Strong support found (bullish)
HSI ? More upside potential (bullish)
KLCI ? Heading higher in the coming week (bullish)
STI ? Still range bounded in the coming week (bearish)

Shanghai Stock Exchange Composite (SSEC) ? Strong support found

More upside in the coming week: SSEC could be heading higher in the coming week after staging a strong rebound off its 10-month uptrend line.

Indicators show signs of a turnaround:With the RSI showing signs of a strong rebound and the MACD histogram showing a bullish divergence to the price action, this could mean further upside momentum for the index in the coming week.

Hang Seng Index (HSI) ? More upside potential

Signs of rebounding at key support:With the index showing signs of rebounding strongly at the 6-month uptrend line on heavy volume, this could mean further upside potential in the days ahead.

Technical indicators more bullish now:With the RSI rebounding for the 2nd time at the 40% mark and the MACD indicator turning around positively at the center line last week, they seem to suggest more upside momentum ahead.

Straits Times Index (STI) ? Still range bounded in the coming week

No clear direction yet: The index could carry on to trade range bounded in the coming week between the 2521 and 2700 levels. Until a break out occurs at either levels, the medium term direction could still be unclear.

Technical indicators more bearish:With both the RSI and MACD indicators still trending down, these suggest that the momentum is still more downside biased.

Friday, September 4, 2009

China Sky - further near-term gains limited


We issued a TA on China Sky on 26 Aug highlighting a positive breakout - and since then, the stock has rallied more than 37% within 7 sessions. But from here on, the stock may find it difficulty to clear our next key resistance level at $0.28.

With the daily RSI already hovering at the overbought region, further near-term gains could be limited.

We have raised our immediate support level up to S$0.25 (protective stop level) resistance-turned-support. Should a correction breach this support, it could mean further bearish implications thereafter.

However, should it take out the $0.28 resistance, it may still face another resistance at $0.295 (gap zone in Jan '09), followed by $0.33 (minor peak in Dec '08).

Singtel - Likely to move to higher end of $3.1 - 3.27 range

Trading interest has faded away in the past month following the stock’s failure to break recent $3.47-52 highs and sharp fall to below key historic $3.36-14 support area.

With rival index heavyweight stocks offering greater trading chances, ST languished, drifting to even below key historic $3.14 support ($3.10 low) but staying well above next $3.02-04 support.

As a result there had not been much positive technical signs to get trading ideas from as the counter fell well below its 13-day MA buy signal followed by periodic loss of 50-day MA support since mid-Aug.

However it managed to re-surface above 50-days after about a week of see-sawing, producing a mild rebound to $3.25 last week and $3.27 on Monday thanks to a cross between 13 and 50 days.

But this proved unsustainable as ST quickly plunged back to $3.14 at the day’s low and close and test of $3.11 in last 2 days with this morning’s low at $3.13.

Nevertheless, the MA cut is the first ray of hope that the stock could be coming out of its narrow consolidation and with the second quarter ending Sep 30 and analysts preparing to revise their forecasts, there should be some change of fortune soon.

First the stock will have to move back to the higher end of its $3.10- 27 range and this should be not too far away as the 13-days MA is flattening and showing signs of turning up for the first time since its downturn on Aug 5 which accompanied the plunge from $3.40 to $3.22, which demolished key historic supports from $3.36, $3.30 and $3.28.

Now it seems an uphill climb with $3.28 acting as first no-entry given that the Aug 31 high was $3.27.

But it should not be too difficult to break into $3.28-$3.36 as the 50- days (at $3.19) is still rising despite the past month’s weakness and with the potential for a more positive cut from a rising 13 (at $3.16) and 50-days, the counter should pull up back to this week’s high soon.

This should also bring it back to the rising trend channel which should be the case as nobody can argue that ST is destined to stay below this channel for more than a short spell of time.

Key fibonacci support and resistances are at $3.08 and $3.35, coinciding with the recent trading band and multi year figures with better chance of a move to a higher $3.14-$3.28 in coming days.

Thursday, September 3, 2009

Genting high price high volumn


Genting SP=1.14 (High Price and High Volume-278mln...making it a Toppish Signal)
Toppish means if you buy now you will get stucked at high prices.

MobileOne - Key breakout suggests more upside potential

Key resistance broken. MobileOne is likely to head higher in the days ahead; this after breaking above the $1.74 key support-turnedresistance on heavy volume yesterday.

Indicators are bullish. The RSI indicator has just rebounded strongly from the 50% mark and the MACD indicator is now on the verge of staging a bullish crossover. Coupled with a breakout from the Bollinger Band squeeze yesterday, these signals suggest further upside momentum ahead.

Initial resistance at $1.85. We peg the immediate resistance at $1.85 (gap formed in Oct‘09), ahead of the $1.92 (peak in Sep’09 and gap formed in Aug’09).

Immediate support at $1.74. Below the immediate support of $1.74, we peg the subsequent support at $1.65 (key resistanceturned- support), followed by $1.58 (resistance-turned-support and 9-month uptrend line).

Wednesday, September 2, 2009

STI - wait for the gap be filled


Straits Times Index, lets waiting the gap 2483 - 2503 to be filled

Tuesday, September 1, 2009

Watch For Break of Major Trendline in STI


In the above chart of the STI daily, we can see a very clear trendline that can be drawn from the beginning of the late March09/ early April09 rally.

This trendline is that it links all the major swing lows of the entire run up, including the recent pullback to the 2520 region. We can observe that there has not been a single trendline violation since the beginning of this run up.

The significance of this is that (1) it should act as interim support for the STI and (2) should this trend line be broken, it would turn into heavy upside resistance.

The high and low of the range is delineated by the week ending 7August09, when the STI sold off from the 2700 mark. Not including this week, the STI has been trading within the high/low range of the week ending 7August09 for the past 3 weeks.

The low (2542) and high (2700) of the range are the key support and resistance zones respectively. Typically, a consolidation range as such is a prime candidate for breakouts. Volatility in the market moves in cycles, and usually periods of low volatility (past 3 weeks) beget periods of high volatility.

In the chart above, we have delineated 2 scenarios for the STI. One for an upside breakout and another breakout to the downside. What we are looking for is for the STI to trade past key support (2542) or resistance (2700) and come back to test it again before pushing off.

For example, a break below key support at 2542 turns key support into key resistance. A second rejection of 2542 would usually be a high probability indication that the STI would be pushing lower. The reverse holds true should the STI trade to the upside beyond 2700 as well. In the interim, last week’s low, 2574, should hold up as shorter term support.

Z-Obee time to take profit


Z-Obee=0.15 (Breaking out and SAR at $0.15, take profit now)

Monday, August 31, 2009

Chinese stocks tumble over 5% may rebound


Chinese shares tumbling over 5 percent and Japanese stocks edging down after the country's opposition party came to power in a landslide victory.

Shanghai's market was hit with another bout of heavy selling, reflecting unease about government measures that could slow the liquidity that's sent the market surging this year.

SSE A SHARE IDX (Corrected almost 50% ...currently sitting on the trendline support...may rebound)

STI - sell into strength


Despite the slightly firmer opening, the STI soon succumbed to profit-taking pressure, which gradually grew over the morning. By the mid-day close, the benchmark index was off 1.2% at 2611.77, although off its intraday low of 2606.05.

Volume was little changed from last Friday's morning session with 1663m units traded, but losers overwhelmed gainers by over 2.5 to 1. Hence it was no surprise that only three of the FTST sub-indices were in the black.

On the technical front, the profit-taking was not unexpected ? the price action last Friday had formed a doji star, which suggested that the market looks pretty indecisive at the moment.
Investors were probably anticipating a dearth of newsflow with the end of the results season (for those companies who have their financial year end in Jun).

But intraday technical indicators are signaling a possible reversal in sentiment ? we may see more bargain hunting in the afternoon if Europe opens positively.

We peg the immediate support at 2601 (psychological and centre line of the Bollinger Band), ahead of 2521 (mid-Aug low and also the lower Bollinger Band). On the upside, the immediate cap is at 2681 (50% retracement of 3906-1455 plunge), ahead of 2700 (psychological).

We also suggested that S-chips and offshore & marine stocks would very likely rise and both sectors have seen sporadic interest. We expect that to continue into this week. However, index stocks have lost some of their momentum and market breadth is now lower than at prior peaks. Our preferred stance is to sell into strength for most index stocks.

US indices have very likely completed a wave 4 move and the DJIA and S&P 500 will very likely break out next week. However, we lower our upside target for the DJIA from 10,000-10,100 towards 9,800-9,900.

Friday, August 28, 2009

Some accumualtion going on at Z-Obee?


Z-Obee=$0.12 (Some accumualtion going on at 0.12?)

Possible STI Weakness Ahead, Driven by S&P 500

The STI is trading within the range of the week ending 7August09 (2700 and 2542). For there to be clear directional movement we will need to see a clean breakout in either direction. The S&P 500’s price action indicates that it might be in the midst of putting in a top. Should we see a weak CRB and a falling S&P 500, the STI should follow suit and decline as well.

Over the past 2 days, the S&P 500 has rejected the 1035 region twice. From the chart, we have 2 shooting stars in a row. Although the sessions closed flat for the day, the rejection of 1035 for 2 consecutive days indicates the inability to push higher in the short term.

The STI will have to contend with 2650 as resistance if we are to see a push to 2700. While the STI has been trading somewhat different from the S&P 500, we cannot ignore the potential topping formation that is present in a major index such as the S&P 500.

We would ideally like to see a divergence top in the STI as well via a push to 2700. This would give more confirmation that the STI might be correcting soon. However, with the potential top in the S&P 500, there is a possibility we might not see a STI top materialise.

For now, we will have to pay attention to the S&P 500 to see if it can confirm the divergence. A strong drop off in the S&P 500 should add pressure to the STI even though their correlation has not been very strong lately.

This also implies that 2700 is key resistance and 2542 key support.

Thursday, August 27, 2009

STI strategy: sizeable correction may be due, if history repeats

MSCI Singapore fell 1.7% in August, similar to the MSCI Asia-Pacific ex-Japan Index fall. Average daily volume rose 20% MoM and 58% YoY to S$1,893m. Consumer staples was the best performing sector, up 6.5% MoM; telecoms the worst, down 8.5%. The market is trading at 18.4x/14.8x 2009/10E PE.

Actual Q2 real GDP growth was -3.5% YoY, better than the flash estimate of -3.7%. Consensus expected a downward revision following weak manufacturing production figures for June. Both private consumption and investment are still down 3.7% and 7.2% YoY, respectively, but less than the -4.2% and -15.1% in Q1, implying sharp seasonally adjusted increases on the quarter.

For Q209, 50% of stocks (by market cap) reported higher than expectations versus 10% below. Sectors that reported meaningfully higher- than-expected results were banks, offshore, media, healthcare, and commodities. Meanwhile, primary residential sales set a new record of 2,767 units in July.

The FSSTI has risen 80% from its trough in March. The speed and magnitude of the market collapse and the subsequent rally is reminiscent of the Asian Crisis. Between Sep 98 and Jan 99, the index rose 90% and gave back 35% of the gains over three weeks, before resuming the rally. This time, if history is repeated, giving up one-third of the gain would lower the FSSTI to 2,280. We remain positive on a 12-18M view. We believe policy tightening is unlikely, growth is not due for a double-dip, and valuations are not unduly dear. Incorporating EPS upgrades and rolling our target to end-2010, we see the FSSTI at 2,960 by end-2010.

ChinaMilk take profit


ChinaMilk=$0.53 (Resistance here at SAR...take profit)

Wednesday, August 26, 2009

China Equity - A-Share Market Needs To See Liquidity Inflow Improve

What’s new — The domestic A-share market took a 6% tumble yesterday. From the recent high on 4th August, the market has declined more than 17% already. Yesterday’s trading volume was also about 40% below the recent peak trading days.

What's behind this — While there has been various speculation on a potential regulatory crackdown, we believe the fundamental reason behind the recent performance is that the A-share market is suffering from a significant slowdown in liquidity inflow, even periodical net outflow since the beginning of July.

Bank lending slowdown has a significant impact on stock market liquidity — According to our analysis, since the beginning of 2009, free-float growth in the domestic A-share market has a quite established relationship with monthly new bank lending. The monthly increases in free-float have been around 30% of monthly bank new lending.

The kick off of IPOs — Due to the suppressed market environment, IPOs were suspended for well over a year and only resumed in July 2009. The timing of IPOs coincided with the slowdown of liquidity inflow which further dampened market sentiment.

Sell down of previous non-tradable shares picked up significantly — We have witnessed a pick up in offloading of previous non-tradable shares that have come out of lock-up period. The volume in July was almost tripled that in January. Taking into consideration that the market almost doubled during this period, the value of the sell-down has probably grown 5-6 times.

Retirement of discounted bills — A meaningful percentage of new loans in 1H09, in particular in1Q09, were discounted bills, which are due to be retired. Typically these have 30 to 60 days maturity, and have been the mostly likely form of liquidity leaking into stock market. As we entered July, the retirement of such bills also placed a negative burden on the market liquidity.

August loan growth pick up could lead the market to a technical rebound, but a more sustained recovery needs to see a more substantial improvement in liquidity — As the market is close to the psychologically important 2,800 level, technical rebound is well expected. In particular, the government has reiterated its stand on continued support to a relatively loose monetary policy, which we believe should translate into some pick up in new lending in August vs. July. However, for the A-share market to resume sustainable upward momentum, we need to see meaningful sustained liquidity improvement from now on which should reverse the above negative factors.

Tuesday, August 25, 2009

STI now going to Elliott Wave 5


The chart of the STI above shows a wave count that conforms to the textbook definition of Elliott Wave. Right now, waves 1 through 4 have defined themselves clearly. Price action has unfolded in accordance to the Elliott Wave sequence.

Wave 1 was the initial run up from the 1455 base. Wave 2 was a directional countertrend move that corrected wave 1 starting from the 1950 region. Wave 3, which is typically the sharpest of the 5 waves, ran up to the 2424 level. Wave 4 was the messy sideways market we saw for about 2 and a half months from May09 to mid July09.

This puts us into wave 5, which is typically the last wave of the sequence. The run up of wave 5 has taken the STI up to the swing high of 2700 region where we saw the STI corrected from. We wrote in our weekly reports that the top at 2700 is too small to be a long term top. In other words, wave 5 is incomplete and unfolding. It thus stands to reason that the trend can still continue and there is a decent chance of another push to the upside before we should consider whether this entire rally has run out of steam. Possible targets are 2700 and 2744.

Perhaps the key point of this report is that the STI and Dollar Index are both in the terminal phases of textbook like Elliott Wave sequences. This allows us to forecast the STI from an individual stand point and also an inter-market one.

From an inter-market perspective, we know that a strong Dollar typically leads to a weak commodity market and in turn, this weighs down on equities. Should the Dollar bottom and the STI top occur around the same time, we might see the magnitude of the STI correction get magnified by the strong Dollar-weak CRB relation.

When wave 5 completes itself, trends usually undergo at least a sizeable correction. At this juncture, waves 1 to 4 have unfolded clearly in the Dollar & STI and this almost certainly puts us in the region of wave 5. (We will avoid sub-wave counts of wave 5 to avoid ‘staring at the tree and missing the forest’)

For the STI, there should be another leg to the upside as wave 5 unfolds. The STI price targets are 2700 and possibly 2744. To mark the start of the correction, what we are looking for is a broader scale topping formation such as a double top divergence spanning perhaps 2 months.

A top of this scale should be sufficient to precipitate a decent sized correction, especially if the Dollar begins to strengthen at the same time. Even more so if the STI top/ Dollar bottom occurs during September and October which are months where we typically see strong seasonal weakness in equities.

China Milk Breakout?


ChinaMilk=0.48 (Breakout Greenline....)

Monday, August 24, 2009

Straits Times Index (STI) - Reaching key supports already


Testing key supports: Despite correcting by >6% over the past 3 weeks, the index is now looking to test the 5.5-month uptrend line and the nearby key supports around the 2500 level.

Technical indicators still pointing south:While both the RSI and MACD indicators are still showing bearish signals, it is unlikely that the next 2424 support would be called into play.


At an important juncture: With the index retreating back to the 20,000 level last week, much remains to be seen whether the index will be able to sustain above this level.

Technical indicators still bearish:With the RSI falling below the 50% level and the MACD indicator still heading lower, the odds may favor the bears.

China XLX - Breakout flag formation


China XLX=$0.52 (Breakout flag formation)

Friday, August 21, 2009

Ausgroup - Strong breakout from trading range suggest further upside

Positive breakout. AusGroup is likely to see more upside in the days ahead after breaking out of its 3-week horizontal trading range and above the key support-turned-resistance level of $0.62 on heavy volume yesterday.

Upside momentum revived. With the RSI rebounding off strongly at the 50% mark and the MACD indicator signaling a strong bullishcrossover yesterday, these seem to suggest renewed strength in the upside momentum.

Immediate resistance at $0.72. Should the breakout materialize, we expect an immediate resistance at $0.72 (support-turnedresistance level) with the subsequent obstacle at around $0.86- $0.875 (gap zone in early Jun ’08).

Initial support at $0.62. Beyond the immediate support at $0.62, the subsequent supports are pegged at $0.565 (lower boundary of horizontal trading range and 5-month uptrend line), followed by $0.45 (troughs in mid May and mid Jun ‘09).

STI and trading ideas on ComfortDelgro and SBS Transit


Technically, the daily RSI seems to be turning back in the positive direction while the MACD continues to trend lower following its negative crossover in early Aug; these mixed signals suggesting that momentum in the near term could be turning for the better while medium term momentum still remains bearish.

The index is already nearing the firm supports; the first is the gap at 2485-2503 (formed over 23-24 Jul); the second is at 2425 (significant peaks in early Jun and also near the 50-day moving average and lower Bollinger Band). These are critical levels and the subsequent reaction of the index at these levels could provide more insights to the sustainability of the index's medium to long term recovery.

On the upside, the index would face immediate resistance at 2600 (psychological level) with the more important cap found at 2681 (50% retracement of the plunge from 3906 to 1455).

ComfortDelgro Corporation Ltd: Worth a Second Look ? ComfortDelgro goes ex-dividend on 25 August. Coupled with a technical buy, investors might consider taking a second look.

SBS Transit Ltd: Buy on Weakness ? SBS Transit goes ex-dividend on 25 August. Coupled with a technical buy, keen buyers might want to watch prices and buy on weakness.

12-month STI target of 2,991

Since 11 June, the market has risen a further 13% to an 11-month high of 323, driven in part by stronger than-expected 2Q results and, consequently, 6% upgrade in consensus estimates. This, in turn, was mainly due to better margins rather than top-line growth. While the market could take a breather in the near term, given the sharp bounce, this suggests that market earnings could see another leg-up as the top-line picks up – particularly during the sweet-spot before costs catch up with revenues.

With 2010E consensus earnings still down by 38% since March 2008 and at only 74% of the peak in 2007, there is probably further scope for consensus upgrades. In particular, we expect upgrades in the transport sector, where earnings are now 20% of 2007’s peak, to kick in.

Our 12-month STI target of 2,991 is based on a five-year average P/B (for 2010) and implies 16% potential upside. The corresponding MSCI Index target is 356, or +15%. Our P/B versus ROE analysis suggests that another 18% 2010E earnings upgrade over the next six to 12 months would bring the market back to the historical average P/B.

We maintain our overweight stance on transport, banks, media, financials and real estate. On the other hand, we remain underweight capital goods and telecom. Our top picks are SIA, UOB and SPH. Within the mid-caps, we like NOL, YZJ and Midas. Our least preferred stocks are COSCO, Sembcorp Marine and SMRT.

Thursday, August 20, 2009

Oceanus after the force sell day


Oceanus=$0.335 (MACD turning up after force sell day)

Wednesday, August 19, 2009

Ho Bee - Positive breakout from flag pattern

Likely more upside ahead. Ho Bee could be poised for more upside in the days ahead after breaking out from a flag consolidation pattern and the key $1.10 support-turned-resistance level on high volume yesterday.

Positive signs from indicators. With the RSI rebounding off its 2.5-month uptrend line and the MACD indicator looking to initiate a bullish crossover soon, they support our view that the upside momentum is returning.

Initial resistance zone at $1.40-$1.48. We expect the stock to advance to the key resistance zone at $1.40-$1.48 (breakout price objective and key support-turned-resistance), breaking which, the next resistance is at around $1.72 (peak in Dec '07).

Immediate support at $1.10. Beyond the $1.10 immediate support, we pegged the subsequent supports at $0.96 (peak in Jun '09) and $0.85 (key resistance-turned-support level).

STI another 43 points to go for support


Straits Times Index=2,526 (another 43 points to cover the gap and reach yellowline support). At the moment, the 2542 low is acting as support. Beyond 2542, support is in the 2500 region, then the 2450 to 2424 region.

Immediate momentum is likely to have a bias to the downside, however, the trend still seems to be in tact at the moment and the possbility of another leg up towards 2700 is still in the cards.
Our view remains the same, namely, immediate momentum has a downside bias, but the uptrend is likely to still be in tact. We need to see how the STI reacts to the 2500 level should it clear 2542. What we are looking for is signs of an intra-day base in a region of heavy support.

Tuesday, August 18, 2009

Oceanus - well supported


Oceanus (well supported at the yellowline). You can visit www.ahyattianxia.cn to check out their new Restaurants in Shanghai. Ah Ya Group is working very hard and fast targeting 20 Restaurants by end of 2009 including Singapore, HongKong, Nanjing, Beijin, Shenzhen, Guangzhou, Ninbo, Hangzhou.

Monday, August 17, 2009

STI still looking for a decline towards 2,480


Straits Times Index (towards yellowline). Straits Times Index (FSSTI) should face resistance near 2,680 and pullback towards at least 2,480. We still maintain that view. The index, which was extremely overbought then, corrected 158 points from a high of 2,700 to 2,542. A minor rebound has thus far brought the index up to 2,648. We see this as a counter-trend rally and expect another leg of decline. In our previous reports, we stated that a wave 5 up move was likely and labelled the breakout from the triangle as a wave 5. There are, however, alternative interpretations which we would highlight as the index unfolds. Meanwhile, we believe the index is due for another correction, which should bring it towards 2,480 (+/-1%).

Friday, August 14, 2009

InnoTek - To fast and too sharp, take profit


InnoTek=$0.40 (To fast and too sharp..take profit)

Biosensors - Profit taking well supported


Biosensors (Profit taking well support at Greenline at $0.57...Hold)

Thursday, August 13, 2009

SingPost - Strong breakout positive

Likely more upside. SingPost has staged a strong break above the previous 2009 high of $0.94 yesterday on heavy volume and this bodes well for the stock.

Initial resistance at $1.00. Should it be able to hold above this new resistance-turned-support, we expect the stock to try for the resistance at $1.00 (upper boundary of 10-month uptrend channel and key support-turned-resistance level) next; breaking which, we see the subsequent key resistance at $1.05 (minor peaks in Jul and Aug '08).

RSI in overbought territory. However, with the RSI already showing heavily overbought signals, we would not rule out a nearterm technical correction.

Immediate support at $0.94. Below the immediate support at $0.94, we expect the next support at $0.905 (resistance-turnedsupport level and 50-day MA), ahead of $0.855 (minor troughs in Jul '09 and lower boundary of 10-month uptrend channel).

STI Trend Still Intact Despite Short Term Weakness


The STI is continuing to decline from a rejection of the 2700 mark. The S&P 500, CRB and Dollar Index have simultaneously tagged their respective key support/resistance levels as well, resulting in a pullback across the board. Short term support for the STI is in the 2500 to 2515 region. There should be room for another leg upward once the STI digest this correction as the current trend is very unlikely to end due to 1 week of reversal.

The STI reacted to the 2700 mark over the past week and has since sold off sharply. The sharp sell off is likely to be due largely to inter-market relations as well. The Dollar Index tested key support at 77.68 to 77.45, the CRB, key resistance at 266 and the S&P 500, the 1007 to 1013 region as well.

The confluence of the major inter-market elements testing key support and resistance leves at the same time made the probability of a short-term reversal high. The STI’s sell off has been particularly sharp due to the sell off from a confluence of the 200 week moving average, the 2700 mark and the 50% retracement from (3907 to 1455) that we mentioned last week.

Key support is rather far away at the recent 2424 swing high, although the 2500 to 2515 region should provide interim support should the STI trade to that level. While the STI is correcting in the short-term, there are no clear signs of a top forming in the daily charts as of yet. Because of this, the overall trend is still long biased. There is still the possibility of another minor leg up to possibly test 2744 once the STI digests this correction.

Oceanus SAR resistance


Oceanus=$0.335 (SAR resistance at $0.355)

Biosensors various Technical Targets at a glance


Biosensors=$0.545 (Technical Targets at a glance)

Wednesday, August 12, 2009

First Resources - Potential breakout at key resistance

More upside ahead. First Resources could be poised for more upside in the weeks ahead. It has not only managed to break above the upper boundary of its 4.5-month uptrend channel but also closed above the key support-turned-resistance level of $0.935 (last seen in early Aug '08) on very high volume.

Still indicating overbought signal. However, we note that the RSI is still indicating an overbought signal, suggesting that a nearterm correction could take place soon. As such, we advocate waiting for a successful retest of this new resistance-turned-support level.

Initial resistance at $1.05. Should there be a confirmation of the breakout, we expect the stock to test $1.05 (support-turnedresistance), breaking which, the next resistance at around $1.13 (support-turned-resistance).

Immediate support at $0.935. Below the immediate support at $0.935, the subsequent support is pegged at $0.845 (minor trough in Aug '09 and centre Bollinger Band), ahead of $0.74 (resistanceturned- support and lower boundary of 4.5-month channel).
But given the current market sentiment... so not too sure.......

Straits Times Index (STI) - Heading back towards the 2500 support


STI may have already corrected 5.6% over the last four down sessions, and it may be due for a technical rebound. But the daily MACD indicator has just initiated a negative crossover (though still high within the positive region); the daily RSI has since fallen out of the overbought region and could continue to ease towards the 50% mark.

We believe that the market may still be intent on testing the near-term support at 2520 (centre of the Bollinger Band) and seeing it hold before staging a stronger rebound; otherwise, the next stronger base for a rebound will come from the support around 2484 and 2503 (gap formed during 23 and 24 Jul).

On the topside, we think that the continued failure to clear 2681 (50% retracement of the plunge from 3906 to 1455) would leave the STI vulnerable to a large pullback, given the strong gains to date. The next potential reversion point is at 2751 (significant bottoms in Jan and Mar 08).

Failed to clear the 2700 key level: Technical rebound aside, the index is still seen locked in a correction mode after failing to clear the 2700 key resistance last week.

RSI falling out of overbought level:With the RSI just fallen out from the overbought level, it seems to suggest that the downside momentum is still intact.

MACD initiating a bearish crossover.The MACD indicator has exhibited a bearish crossover, suggesting that the correction could extend further in the coming week.

Nasdaq and S&P500 hard to clear the resistance - tone turn bearish


NASDAQ - 2000 key resistance proved too tough to clear

Further correction likely: The continued failure to stay above the key 2000 resistance level could see the index heading lower still in the coming week.

Indicators showing bearish signals:With the RSI on the verge of falling out from the overbought level and the MACD initiating a bearish crossover last week, they also suggest that the downside momentum is building up.


S&P500 - Hovering at key 1000 level

Hovering at 1000 key level: The index is currently hovering at the 1000 key level and it could still break either way.

Technical indicators favor correction:But with both the RSI and MACD indicators looking to head lower, the risk is to the downside.


Dow Jones Industrial Average (DJIA) - Tone has turned bearish

A tall order to reach for the 9652 resistance:After maintaining above the 9000 key support successfully, the index may struggle to reach the next resistance at 9652.

Technical readings point bearish divergence:This as the RSI has shown a bearish divergence to the price over the last 3 weeks and the MACD indicator are showing signs of a bearish reversal, both suggesting that the tone is starting to turn bearish for the index.

Tuesday, August 11, 2009

All Asia indexes show more downside


Hang Seng Index (HSI) - More downside bias in the near term

Retesting the 20,000 key support:The HSI could see further correction this week to re-test the 20,000 resistance-turned-support level.

Technical indicators showing bearish signals:With the RSI heading lower and the MACD indicator on the verge of a bearish crossover, it is likely that the near term correction could extend this week.


Shanghai Stock Exchange Composite (SSEC) - Long awaited correction to continue

In a correction stance: SSEC is likely to head lower in the coming week after its failure to re-test and break above the key 3456 resistance successfully.

Bearish divergence: The RSI has been signaling a bearish divergence to the price action over the last one month, suggesting that further correction could be inevitable.

Bearish crossover by the MACD indicator:With the MACD exhibiting a bearish crossover last week, we could see the index sliding further this week.


Nikkei 225 - Heavily overbought signals suggest more downside bias

Doji candlestick suggests uncertainty:With the emergence of a Doji candlestick yesterday signifies that the market is getting uncertainty and points to potential near-term consolidation; there is also a risk that the index head south to retest the key resistance-turned-support level at 10,162.

RSI heavily overbought: With the RSI still showing heavily overbought signals, the index also looks likely to correct further in the near term.

Singtel support see at $3.1


SingTel=$3.18 (Support seen at $3.10 which was previous resistance)

STI index - Be Wary Of October

247,000 jobs were cut in the US in July, the smallest in months (June’s job loss was revised downwards to 443,000 from 467,000), and reason for yet another strong session on Friday, with benchmark indices up almost 2% (Hang Seng surged 2.7% in tandem yesterday). Dow however fell 32 points yesterday.

Another well-known “guru” has however advised caution: Mohd El-Erian, the co-CIO of Pimco, the world’s largest bond fund, reiterated that the US market is on “prolonged sugar high”.... Mark Mobius meanwhile expects global markets to drop as much as 30% “anytime, and probably this year”, after the sharp rebound.

China’s Pime Minister Wen Jiabao reiterated that the government’s mix of active fiscal policies (chief of which is the Rmb 4 trillion stimulus package) and appropriately relaxed monetary settings must stay in place because “we still face many hard-ships”, “international economic outlook remains unclear”, and pressure from falling external demand “remains heavy”. (It is perhaps good that bank lending slowed down significantly in July from June, after hitting a total of Rmb 7.37 trillion in the first 6 months, representing 25% of China’s GDP!)

Given that the 60th anniversary of the founding of communist China is 7 weeks away (Oct 1st), it does look like nothing should be “allowed” to “rock the boat”, as to trigger a big drop in the Shanghai market, as happened on July 29th when the index fell 5%. We believe this makes markets all the more vulnerable if the rally were to continue unabated in the coming weeks.

Technically, note that the STI is now 1.4x its upwards sloping 200-day moving average. In the last 20 years, this ratio has tended to peak at 1.2-1.4x, and bottomed at 0.6-0.8x. Exceptions were 1999, when the ratio hit 1.53x in May, and in October last year, the ratio went as low as 0.56x.

Friday, August 7, 2009

Oceanus - buy for potential rebound?


Oceanus=$0.335 (Buy for potential rebound to SAR at $0.365, place stop loss at $0.32)

SSE A - may have further corrections


SSE A SHARE IDX=3,480 (May correct towards the yellowline at 3,348)

STI retract to gap around 2500?


Straits Times Index=2,565 (Retracing towards the gap 2,483-2,503)

Thursday, August 6, 2009

ChinaZaino - Potential bull flag formation


ChinaZaino=$0.25 (Potential bull flag formation in the making ? Resistance at $0.255)

Wednesday, August 5, 2009

STI drops may fall further to cover gap


Straits Times Index=2,610 (fell below Greenline at 2,630, may fall to cover gap at 2,483-2,503)

Tuesday, August 4, 2009

InnoTek Breakout ?


InnoTek = $0.32 (Breakout $0.305)

Hongkong Land - Breakout from key resistance suggests further upside

Key resistance taken out. Hongkong Land could see further upside after successfully taking out the US$3.90 key supportturned- resistance level. Incidentally, the last time the counter closed above this key level was nearly a year ago.

Renewed upside momentum. With the MACD indicator showing signs of turning up again, it suggests that the upside momentum could be building up again.

Near term correction likely. However, as the RSI is still indicating a heavily overbought signal, we could see the stock retesting the US$3.90 key level again. A successful retest at this support could confirm and form a base for the next leg of recovery.

Initial resistance at US$4.38. We expect the stock to test the initial resistance at US$4.38 (minor peaks in Jul ‘08), breaking which, the next resistance is at US$4.55 (gap zone in Jun ‘08).

Immediate support at US$3.90. Below the key US$3.90 support, the next support could be found at S$3.74 (resistance-turnedsupport level).

STI at 3-year overbought levels


In our previous report, we stated that we were equally biased towards an upside or downside breakout from a triangle formation, but added that a break above 2,300 would bring the index towards 2,600. This is also in line with the view, expressed in our mid-year strategy report, indicating a minimum upside of 2,680. Thus far, the index has reached a high of 2,659.

We see limited near-term upside for the index and expect a pullback over the next two days. At the very least, the index should cover a gap at 2,485. Our expectations of an imminent peak and pullback is not primarily based on the presence of a gap, but wave patterns on highly correlated indices such as Hang Seng Index, Dow Jones Industrial Average (DJIA) and FTSE. The Straits Times Index (FSSTI) chart below shows an extremely overbought price oscillator index and that too from a weekly perspective. The index is also close to a 50% retracement level of 2,680 (the basis behind our initial target).

Similarly, the DJIA is extremely overbought and is close to an important Fibonacci resistance level. Near-term wave analysis suggests that the DJIA has completed a five wave rally from the July low of 8,087. The odds of a 50% retracement of the advance from that level are high.

Monday, August 3, 2009

Technically buy IndoFood Agri, Golden-Agri, Kencana Agri

IndoFood Agri Resources (IFAR SP; S$1.52) – BUY

• The stock rallied sharply after breaking out of its bullish flag pattern in the middle of July. It has tested the May highs of S$1.49 yesterday and managed to breakout above it.

• The new-year highs however were not accompanied by new highs in its indicators. The MACD is positive but is nowhere near the highs in May. This suggests that investors should be wary of buying now. Its RSI is now overbought suggesting that a short term pullback is likely.

• Prices could adjust downwards slightly to neutralise the overbought RSI soon. Buy on weakness with support seen at S$1.36 and S$1.27. Upside resistance is seen at S$1.60 and S$1.74.

Indofood Agri Resources Limited is an integrated agribusiness company. The Company and its subsidiaries are involved in research and development, oil palm seed breeding, oil palm cultivation and milling. Indofood Agri Resources also refines, brands and markets cooking oil, margarine, shortening and other palm oil products.

Golden Agri-Resources (GGR SP; S$0.415) – BUY

• The stock’s long term uptrend is still intact. It broke out of its short term downtrend channel last week and in now rallying to test the middle band resistance of its long term uptrend channel.

• Its indicators currently suggest that the stock is could kick on higher. However, in the short term, a minor retracement is likely as there is some selling pressure near the middle resistance.

• The stock is still a buy on weakness as long as prices stay above the 50-day SMA at S$0.37-0.375. A breakout above the middle band resistance at S$0.415 could see the stock push on towards S$0.455 and even S$0.50 next.

Golden Agri-Resources Limited cultivates, harvests, processes, distributes, and sells crude palm oil and palm kernel. The Company also refines crude palm oil into cooking oil, margarine, and shortening for sale and distribution.

Kencana Agri (KAGR SP; S$0.315) – BUY

• The stock broke out of its consolidation pennant three weeks ago. It is now rallying after forming a base above its 30-day and 50-day SMA at S$0.27-0.28. The moving average now acts as strong support for the stock.

• Indicators have continued to improve and remain in buy mode. The upside resistance is seen at S$0.345, the May highs. A breakout above could see the stock test S$0.375, its high since inception.

• Aggressive investors may want to buy now but place a stop loss at S$0.265 or below. S$0.245 is the next support.

Kencana Agri Ltd. produces crude palm oil and crude palm kernel oil with oil palm plantation. The Company operates a bulking terminal and logistics services for storage and transportation purpose. Kencana Agri Ltd. also operates a renewable biomass power plant to generate electricity by utilizing waste recycled from the crude palm oil process.

KS Energy - Bullish breakout suggests more upside to come

Positive breakout at key resistance. KS Energy could be poised for more upside in the weeks ahead after breaking above the key $1.28 level (support-turned-resistance and 1.5-year downtrend line) on heavy volume yesterday.

Upside momentum intact. The MACD indicator has just risen above the centerline recently, suggesting that the tone has turned positive.

Near-term consolidation likely. However, the RSI is currently indicating overbought signals, alluding to the possibility of a nearterm correction.

Key support at $1.28. We think that the immediate support at $1.28 is key, although we do see subsequent supports at $1.08 (resistance-turned-support and 100-day MA), followed by $0.97 (trough in Jul ‘09)

Initial resistance at $1.39. But should there be a successful retest of the $1.28 level, it will confirm the breakout. This could lead to a test of the initial resistance at $1.39 (peaks in Oct ’08 and May ‘09), ahead of the next resistance at $1.51 (2009 high).

STI Approaching Cluster of Resistance Levels

The STI is approaching a cluster of heavy resistance between 2660 and 2750. There are retracement levels, the 200 week moving average and historical highs in this region. Our view is that the probability of a pullback in this region is high, however, the cluster of resistance levels makes it difficult to identify a more precise region where the pullback might begin. The market might see-saw between resistance levels before selling off.

We mentioned previously that there are several heavy resistance levels around the 2660 to 2700 region. Historical resistance is present at the 2580 and 2660 levels that we mentioned last week, a fibonacci retracement level at 2680, the 200 week moving average at about 2700 (not shown) and historical resistance at 2744.

The stagger of the different overhead resistance levels on the whole, implies that there is a very high probability that we will see a correction in this region. However, the fact that there are a few heavy resistance levels in close proximity makes it difficult to pinpoint which level will eventually exhaust buying pressure and precipitate a pullback.

We might see the STI rally to test a few of the higher resistance levels before pulling back decisively.

Thursday, July 30, 2009

China XLX - Bullish breakout suggests medium-term upside

Key resistance breached. Having been range-bound over the last 10 months, China XLX is likely to head higher in the medium term after breaking above the top boundary resistance at $0.48 yesterday on heavy volume.

More upside in the medium term. The MACD indicator has also just risen above the centerline following its recent bullish crossover, pointing to more upside possibilities in the weeks ahead.

Possible near term consolidation. However, as the RSI is currently showing heavily overbought signals, a consolidation could happen soon – we advocate accumulation as the counter heads back towards the new support base at $0.48.

Immediate resistance at $0.56. Beyond the immediate resistance at $0.56 (minor peaks in Aug and Sep ‘08), we expect the subsequent resistance to be at $0.68 (support-turned-resistance level).

Immediate support at $0.48. Immediate support is pegged at $0.48 (key resistance-turned-support level), ahead of $0.41 (resistance-turned-support level).

Rotary - Positive breakout suggests further upside

Breakout from key resistance. Rotary could be poised for more gains in the weeks ahead after breaking above the $0.82 key support-turned-resistance level on heavy volume recently. With this level already retested and successfully held yesterday, it could provide the platform for further advances.

More upside in the medium term. The MACD indicator is still trending up along the 10-month uptrend line, pointing to more upside possibilities in the weeks ahead.

Near-term consolidation pressure. However, the RSI is currently still showing overbought signals, hence Rotary could still face nearterm consolidation to relieve this pressure.

Initial resistance at $1.04. The immediate resistance is at $1.04 (gap in Jan ’08 and peak in Feb ‘08), breaking which, the next resistance is at $1.16 (key support-turned-resistance level).

Key support at $0.82. Below the $0.82 key support, the next support is pegged at $0.74 (5-month uptrend line), ahead of $0.66 (resistance-turned-support level).

The risk of STI consolidating has increased

The risk of STI consolidating has increased because:

1) Technicals: STI 2637 was tested this week a level that we believe should cap the index’s rise in the short-term. The Hang Seng is also approaching resistance levels from 20570-21100 (HSI rose to a high of 20664 this week). We observed ‘hang-mans’ formed on the Dow’s daily chart over the past few days, which is a sign that the rally has run out of steam.

2) Valuations are now very near to historical average. According to Datastream, the Singapore market P/B is at 1.35x versus historical average of 1.39x. The MSCI Singapore is trading at 16.9x FY09 earnings, which already exceeds the historical average of 15.9x. This suggests that the stock market rally has priced in this year’s earnings from a historical average valuation. In addition, its 12-mth rolling forward PE is currently at 15.4x, which is also fast approaching the historical average of 15.9x.

3) Sentiment for property stocks, which led the market higher in the past 3 weeks, could be dampened following comments by Minister of National Development Mah Bow Tan that the Singapore government is monitoring closely speculative activities that are trickling into property market.

4) 2 major Chinese banks ICBC and CCB aim to set a ceiling on new loans, this according to a ST article. If put in place, the FY lending ceilings imply that the 2 banks have already issued about 80% of their total lending for the year, suggesting that loans for 2H will be much reduced.

Technically, we see STI consolidating to either the 2360 (23.6% downward retracement) or 2190 (38.2% downward retracement) levels in coming weeks/months. We also maintain our technical view that the consolidation is a ‘healthy’ one because once it ends; the E-wave count suggests that STI should make fresh YTD highs.

Wednesday, July 29, 2009

Straits Asia - double top formation


Chart for StraitsAsia=$1.89 (Double top formation, sell)

SSE Shanghai -7% - Party is overed


SSE A SHARE IDX (First sign of party over - Sganhai fell 373 points or 7%)

The Shanghai Composite has gained 82 percent this year, the world's second-best performing stock market, after slumping 65 percent in 2008. The index, which doubled in 2006 and 2007, remains 2,789.84 points below its peak of October 2007.

Stocks on the Shanghai index trade at 36.6 times earnings, the highest since January 2008 and more than twice the 17 times fetched by the MSCI Emerging Markets Index.

Ezra - take profit now


Chart for Ezra=$1.42 (Called on 9 Jul when price crossed greenline. Target reached take profit now)