Thursday, April 30, 2009

Buy Suntec Reit, JMH, Straits Asia Resource Technically

Suntec REIT (SUN SP; S$0.72) – BUY

• The stock is now testing its medium term downtrend resistance at S$0.73. A breakout above this resistance is bullish for the stock. The next resistance is at S$0.785 and S$0.86.

• MACD has reconfirmed its golden cross while RSI has also inched higher from its neutral position.

• Buy half now and the rest on the breakout above the said resistance. Put stop loss below its 30-day SMA at S$0.635.

Suntec REIT owns prime office and retail space in the Central Business District(CBD) of Singapore. Its portfolio comprises of office and retail properties in Suntec City, a prime landmark property strategically located in the CBD and the largest integrated commercial complex in Singapore (including Singapore’s largest shopping mall).

Jardine Matheson (JM SP; US$21.22) – BUY

• The stock is still languished in its medium term sideways trend channel despite having bounced off its Mar lows of US$15.90. It tested the upside resistance at US$23.90 but it did not have enough in the engine to breakout above it. It is now forming a base near the middle band support at US$19.90.

• MACD and RSI are starting to hook upwards again, probably suggesting that it could soon head higher to retest its upper resistance at US$23.90.

• Furthermore, it is still above its 30-day SMA, which is now at US$19.65. Investors may want buy near the support levels of US$19.90. Cut losses if prices fall below the US$19.00.

Jardine Matheson's interests include Jardine Pacific, Jardine Motors Group, Jardine Lloyd Thompson, Hongkong Land, Dairy Farm, Mandarin Oriental, Jardine Cycle & Carriage and Astra International. These companies are leaders in the fields of engineering and construction, transport services, insurance broking, property investment and development, motor trading, retailing, restaurants, luxury hotels, motor vehicles and related activities, financial services, heavy equipment, mining and agribusiness.

Straits Asia Resources (SAR SP; S$1.07) – BUY

• The stock tested the uptrend channel resistance but failed to breakout above it. It has since pullback to close to its 30-day SMA before rebounding higher.

• Indicators are just about to turn negative, suggesting that the stock is still in consolidation.

• Investors should buy on weakness, preferably near the 30-day SMA currently at S$0.94. Stop loss is at S$0.89 or below. The stock is likely to rebound to try to retest the S$1.19-1.20 resistance again soon.

Straits Asia Resources (SAR) is primarily engaged in thermal coal mining on Sebuku Island, South Kalimantan, Indonesia. SAR commenced operations at its Sebuku mine in 1997 and holds the rights from the Indonesian Government to mine for coal in its concession area until 2027. A substantial portion of Sebuku coal is exported, largely under long-term contracts, to power generation companies within Asia.

Sponsored Links

SPC - Likely more near-term correction

- SPC could face more near-term downside pressure following the formation of a bearish engulfing pattern just under the 200-day MA resistance, which could possibly lead to a retest of the resistance-turned-support upper boundary of its 6-month uptrend channel.

- Meanwhile, the RSI and Force Index indicators have displayed bearish divergence to the price action over the last 3 weeks. Coupled with the MACD indicator making bearish crossover yesterday, our view is reinforced that further correction is very likely in the days ahead.

- We expect the correction to find an initial support at around $3.11 (upper boundary of 6-month channel); failure of which could see a test of the subsequent support at $2.92 (minor gap in Oct ’08 and minor trough in early Apr ’09)

- Any immediate resistance is pegged at around $3.49 (2009 high), ahead of $3.81 (minor peak in Oct ’08)

Dow breakout from trendline?


DJ INDU AVERAGE (Looks like a breakout from trendline resistance...wait for confirmation)

CapitaRChina go to 0.9?


CapitaRChina=$0.80 (To recover towards SAR at $0.88)

CapitaMall retest 1.30?


CapitaMall=$1.24 (Price crossed yellowline at $1.23....could retest $1.30)

Wednesday, April 29, 2009

Dow could not break trendline


DJ INDU AVERAGE=8,016 (Still could not breakout the trendline resistance, chances of pulling back to 7,500 is high)

SPH take profit!


SPH=$2.98 (Greenline crossed yellowline at $2.54.....Take profit as target reached)

Biosensors - after pull back...


Biosensors=$0.425 (After hitting the first target of $0.46 on 24 Apr, it has pullback to low of $0.42.....)

STI - consider sell into strength


Straits Times Index =1,852 (slightly above greenline at 1,849....consider sell into strength)

The STI made a technical rebound as expected, but we may not see much more upside from here; the index is currently still tracking a 6-day downtrend channel and is likely to face immediate resistance around 1840.

We see that the intraday MACD has made a bearish crossover and should the RSI fail to hold above the 50 mark, we could see the index giving up its gains in the afternoon session.

Ezra rebound could end


Ezra=$0.91 (Technical rebound could end at $0.91)

DBS rebound capped


DBS=$9.04 (Technical rebound cap at $9.06 Greenline Resistance)

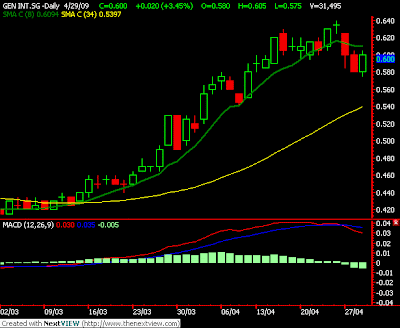
Gen Int second chance to sell?


Gen Int=$0.60 (Technical rebound, second chance to sell?)

S&P500 Double Top


What is worrying, however, is if you look at the bigger picture. The major indices have put in a mammoth, long-term double top. Here is a chart of the S&P since 1970. You can see it very clearly in the chart below ? in 2007, at the 2000 highs, the markets ran out of buyers. But you can also see, the market is now retesting those 2002-3 lows. They were first tested in November 2008 and we got a rally. Now they're being retested again.

This really is a key juncture for the stock markets. If these lows hold, we could be marking an important bottom (although I have no doubt this will be retested). But if we break down below these lows, we're going back to test 1996 prices (600 on the S&P) and possibly even 1994 prices (S&P around 450). These current lows will then mark an important point of resistance that will slow any future bull markets (in other words, when markets rise again, the current lows will be where they start to falter).


On the positive side, Bloomberg reported this week that Elliot Wave International's Robert Prechter, a notorious bear and practitioner of 'Wave theory', has advised his clients to cover their shorts (bets that the market will fall). He first recommended that his clients short US stocks in 2007, saying that "aggressive speculators should return to a fully leveraged short position." But Prechter wrote to his clients this week, saying that "the market is compressed. When it finds a bottom and rallies, it will be sharp and scary for anyone who is short. I would rather be early than late."

Tuesday, April 28, 2009

Celestial - high chance of breakdown


Celestial=$0.135 (Likelhood of breakdown at $0.135 is vey High....target=$0.12)

Gen Int likely to pullback


Gen Int=$0.60 (likely to pullback towards yellowline at $0.535)

- Following the formation of a bearish evening doji star pattern just shy of a key resistance level (Jun ’08 peak), Genting is likely to face more downward pressure, as that could spell a possible end to its current rally.

- As the technical indicators have also displayed bearish divergences to the price over the past month, coupled with the RSI’s fall from the overbought region and the MACD cutting down high in the bullish region, they reinforce our view that the recent rally may have come to an end.

- Any downside from here is likely to find initial support at $0.55 (resistance-turned support level), ahead of $0.49 (resistance-turned support level in Mar ’09)

- On the other hand, any upside from here will likely meet immediate resistance at S$0.64 (2009 high), followed by S$0.73 (minor peaks in Oct & Nov ‘07).

Monday, April 27, 2009

Chart for Straits Time Index under Flu


Stay clear while the selling continue.

Friday, April 24, 2009

Dow coming down more?


DJ INDU AVERAGE (getting into the range with support at 23% retracement)

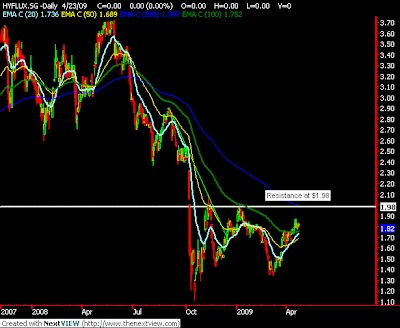
Hyflux to test 200Day MA


Hyflux=$1.81 (Position for a test of 200Day MA next month)

Biosensor above 200day MA finally


Biosensors=$0.46 (Above 200Day MA now after many attempts)

STI - Wait more before jump in


Straits Times Index (wait for further correction....don't jump in too early)

Gold rises 1 percent on China reserve news

Gold rose 1 percent to a three-week high on Friday after China said it had been buying the precious metal for its reserves, confirming speculation it has been bulking up its reservesand raising hopes of more purchases to diversify its massive foreign exchange holdings.

The government has 1,054 tonnes of gold in its reserves, up 454 tonnes tonnes since 2003, Hu Xiaolian, head of the State Administration of Foreign Exchange(SAFE), said. This makes it the fifth biggest country holder.

Spot gold rose to $910.90 per ounce b 0528 GMT, up 1 percent from New York''s notional close of $902.00. It has risen 5 percent so far this week, putting it on track for the biggest weekly gain for two months.

Prices have also been by physical demand from India, the world''s largestconsumer, ahead of the Akshaya Tritya festival on April 27, an auspicious time for gold buying.

Low interest rates globall are helping to bolster financial strength for banks and securities firms, but consumer demand was still slack, limiting rises in stocks and keeping risk aversion alive, traders said.

Ezra unable to stay above


Ezra, Buy signal cancel as Ezra was unable to stay above Greenline.... Cut and Go

Genting less likely to get higher......


Gen Int, we called at $0.605 for a potential test of 6Feb's high of $0.67... however, it looks less and less likely to reach.... so Sell

Sell Jardine Strategic, Jardine Matheson, Jardine C&C technically

Jardine Strategic Holdings (JS SP; US$10.76) – SELL

• The stock tested its long term downtrend resistance at US$11.90 but did not breakout above it. It has since retraced to current levels and held above its 30-day SMA at US$10.29.

• MACD has turned negative while RSI continues to edge lower from here.

• Sell on strength is likely the best option here considering the bearish indicators. A break below the support at US$10.29 would signal that more downside is likely with the next support at US$9.50 and US$8.58.

Jardine Strategic Holdings Limited is a holding company with principal interests in Jardine Matheson, Dairy Farm, Hongkong Land, Mandarin Oriental, and Cycle and Carriage. The Company, through its subsidiaries, operates auto distribution, food and retailing, property investment, property development, and hotel operations.

Jardine Matheson (JM SP; US$19.90) – SELL

• The stock is still languished in its medium term sideways trend channel despite having bounced off its Mar lows of US$15.90. It tested the upside resistance at US$23.90 but it did not have enough in the engine to breakout above it.

• MACD and RSI are starting to hook downwards again, probably suggesting that it could soon head lower.

• A break below its middle band support at US$19.90 is likely bearish for the stock in the near term. The following support is at US$19.05 and US$18.00.

Jardine Matheson Holdings Limited is a multinational enterprise with a portfolio of businesses focused on the Asia-Pacific region. The Group's activities include financial services, supermarkets, consumer marketing, engineering and construction, automobile trading, insurance broking, property investment, and hotels.

Jardine Cycle & Carriage (JCNC SP; S$13.48) – SELL

• The stock rallied more than 71% from its Mar low of S$8.22 and hit its long term downtrend resistance line at S$14.58. However, the buying momentum faded soon after. It has now fallen below its short term uptrend channel at S$14.05.

• Indicators have just turned negative. The RSI has also reached overbought levels and has turned lower while its MACD has just confirmed its dead cross.

• Investors should SELL now as the downside support is only S$12.16 and S$11.41.

Jardine Cycle & Carriage Limited distributes, retails, and assembles motor vehicles, parts, and accessories. The Company also develops and invests in properties, and provides after-sales services.

Thursday, April 23, 2009

SIA Engineering - Likely correction in the near-term

With the formation of a dark cloud cover (bearish) pattern just under its 6-month downtrend line and upper Bollinger band, SIA Engineering could befacing more correction pressure in the near term.

Technical indicators (Force Index, RSI and MACD histogram), which haveindicated bearish divergences to the price action, support our view that themomentum of the current rally is waning.

Should the reversal takes place, we expect the counter to find relativelystrong support at $1.80 (resistance-turned support level), followed by $1.73(minor gap in Mar ’09).

On the other hand, any upside from here will likely meet immediateresistance at around $1.99 (6-month downtrend line and minor peak inearly Apr ‘09), followed by $2.27 (Dec ’08 high).

Biosensors threw back to $0.405.. now trying the trendline resistance again


Technically, first target at $0.46 follow by $0.53....Final target could be $0.75.

Investor should consider AscottREIT


Ascott REIT($0.47) - It has been hit badly in this econ0my crisis. Market is also focasting a dip fall in its distributable income from its service apartment business. Hence, we have reason to believe the negatives have been priced in. Trading at 69% discount to its NAV at $1.51, we believe it is a medium term buy with target at $1.00.

Wednesday, April 22, 2009

HSI uptrend non stopable


Our target for Hang Seng Index (HSI) is 16700. Swings, volume and RSI are all indicating a continuation in rally. Although the convergence of resistance is being tested now, we believe the odds are that the breakout is likely to be irresistible.

Hang Seng Index (HSI) is expected to retrace 38.2% of its down-leg from 26387 to 10663, which would be 16700.

The swings for 5-week time frame (blue line) has formed a higher lows and in the midst of forming a higher highs.

The rally is less likely to be short-lived or end any time soon as the increase in HSI has been coupled with strong volume.


Resistance level at 15795 is a key one in determining the subsequent movement. The 200-day moving average and resistance level defined by previous peak at 11th December 2008 are converging.

A convincing breakout for both resistance level and moving average is a necessary condition for a continuing bull trend.

At this juncture, we believe the odds are that the breakout is likely to be irresistible. As we can see from chart, the smaller time frames (white line and blue line) continue to form higher highs and higher lows.

Although the advance of RSI is slowing down, the signal given is still a positive one so long as it continues to tread above 50 level and also its corresponding 14-day moving average.

Capitaland - Too strong a resistance to overcome for now


- After a rally of 84% over the last 1.5 months, CapitaLand may be headingfor a pullback in the coming weeks; this as the recent price action hasformed a dark cloud cover (bearish pattern) just below its strong 1-yeardowntrend resistance line.

- Technical indicators (Force Index, RSI and MACD Histogram) have beendisplaying bearish divergence to the price action over the last few weeks;coupled with the OBV indicator falling below its 1-month uptrend line, webelieve that the recent rally has weakened considerably.

- Hence we expect a pullback to the immediate support at around $2.66 (1-month uptrend line, also minor gap in mid Apr ’09 and the 200-day MA),with the next support at $2.40 (minor trough and gap in early Apr ‘09).

- Any upside from here will likely meet resistance at around $3.13 (Apr ’09high and 1-year downtrend resistance line), followed by $3.54 (minor gap inAug ’08).

CoscoCorp - eventhough today is Due 2 for the trade done on 16 Apr...


On 16 Apr, volume was a huge 72mln shares traded as high as $1.18. However, the day chart looks like a breakout from a bullish flag. We shall monitor for a while....it could be a buying opportunity after the force selling is over.

Tuesday, April 21, 2009

Golden Agr and Indo Agri - after the pull back


GoldenAgr=$0.35 (After pullback from 200DMA......a flag formation has formed)


IndoAgri=$0.815 (like Golden Agri, it also is forming a flag formation)

Genting - HTF breakout?


Gen Int=$0.605 (forming a HTF...target $0.67 is possible if breakout, high of 2 Jun 2008)

Noble Grp wait for pullback)


Noble Grp another 200D MA Stock...wait for pullback

Different views on STI - still down no matter how you view it


It seems like the recent high of 1947 will remain as the near-term resistance for the time being as the recent rally seems to have lost its strength.

While the Straits Times Index appear resilient on the surface, it remains locked in a rising wedge formation: As the index is sitting right on the rising wedge’s support line, risk of a break is high – a scenario that would also imply 130-point downside risk for the STI.


Straits Times Index is heading towards 1,759 or 38% retracement level. Market breadth indicators also support the same conclusion as the rising wedge theory, as decliners have outpaced gainers since last Thursday. This is a clear signal that the broader market is making adjustments to the overbought condition.

Monday, April 20, 2009

Sell technically Golden Agri, Swiber, F&N

Golden Agri-Resources (GGR SP; S$0.36) – SELL

• Golden Agri (GGR) posted a dark cloud cover candle last week. It is also trading very near a cluster of resistances, which increases the chance of a reversal. S$0.385-0.40 and S$0.42 are strong resistances.

• Technical indicators are starting to weaken with the MACD and RSI hooking downwards. RSI has also issued a sell signal last week.

• Any rebound towards the resistance levels should be seen as a chance to sell. Immediate support is at S$0.35, but we do not expect this level to hold.Stronger support is at S$0.32 and S$0.29.

Golden Agri-Resources Limited cultivates, harvests, processes, distributes, and sells crude palm oil and palm kernel. The Company also refines crude palm oil into cooking oil, margarine, and shortening for sale and distribution.

Swiber Holdings (SWIB SP; S$0.515) – SELL

• Appears to be hitting robust resistances. The bearish implication of last Thursday’s candle would likely be felt soon. Take profits now as resistance at S$0.525 and S$0.56 is likely to cap any more upside for now.

• MACD is flattening out suggesting that the buying momentum is starting to ease. RSI has hooked up again but is still below its previous highs.

• A break below the S$0.495 could see more selling pressure set in. The next support is at S$0.445 and S$0.385.

Swiber Holdings Limited is an offshore marine support company. The Company services include engineering, procurement, and construction services.

Fraser & Neave (FNN SP; S$2.71) – SELL

• The stock is now at a critical juncture. It needs to breakout and close above the S$2.72-2.75 resistance trend line to turn bullish again. If the resistance is broken, then the next resistance is at S$3.00.

• However, we think that this resistance will not give way so easily. MACD and RSI are still marginally positive but they are below their previous highs. It could potentially be a negative divergence here but we need further confirmation.

• Nevertheless, we think that it may be wise to take some profit here. If the breakout does take place, then investors could still get back in albeit at a slightly higher level. However, if the breakout fails to materialise, then it could ease to test its support at S$2.55 and S$2.38.

Fraser and Neave Limited produces and sells soft drinks, beer, stout, dairy products, and glass containers. The Company also operates publishing and printing businesses and develops and invests in properties.

Becareful for STI


Straits Times Index=1,896, Cautious as STI's 3rd attempts to clear 1,953 is not successful.

Becareful for Dow


DJ INDU AVERAGE=8,131, still unable to clear the trendline resistance and 100D MA....Cautious!

Friday, April 17, 2009

UOB risk of falling back increased


UOB=$11.08, Rising Wedge Formation, Risk of falling back to $9.50 has Increased.

CAO filling gap


ChinaAOil=0.95, eventhough bullish after crossing 200DMA, but leaving too many gaps behind waiting to be covered

Hyflux going higher and higher?


Hyflux = 1.84 could test the resistance 1.98 next few weeks.

Straits Times Index around 1900 level


Increasing Risk of 30% pullback to 1,783...stayout first. But the Standard & Poor’s 500 Index may rise 17 percent to 1,000 in the next three months as government spending boosts bank profits, investor Marc Faber said.

“The market very near term has become somewhat overbought and the correction should essentially follow, but I doubt it will go and make new lows in the intermediate future,” Faber said. “The lows in early March at 666 in the S&P will hold and we’ll have another push up into July.”

Thursday, April 16, 2009

All the U shape - Jardine CC, Cosco, China Fish, Asia Env, Gen Int


Jardine C&C=$14.48 (Called on 2 Apr when broke 200DMA at $12.30...Take profit)


CoscoCorp=$1.17 (Short term target reached at $1.16..Take profit and wait for pullback)


China Fish=$0.74 (called at $0.65..target reached..take some profit)


Asia Env=$0.135 (Brokeout from the 4months trading range...look to the gap at $0.18-0.19 as it may be filled)


Gen Int (why we need to respect the 200DMA....example herein)

SELL DBS, UOB, SGX technically

Singapore Exchange (SGX SP; S$6.21) – SELL

• The stock broke out of its long term bullish wedge pattern and rallied strongly to current levels. However, the rally has been too sharp and too fast. The angle of the run-up suggests that this run is not sustainable in the long run, and a pullback is likely to take place. The strong resistance is at S$6.30 and S$6.50.

• The overbought RSI is a sign of caution that this rebound is coming to its tailend. Investors should be looking to take profits now and not looking to buy at current levels. Sell on strength.

• A pullback to retest the breakout support at S$5.18-5.30 is likely. The rising 30- day SMA at S$4.77 is the next support.

Singapore Exchange Limited owns and operates Singapore's Securities and derivatives exchange and their related clearing houses. The Company also provides ancillary securities processing and information technology services to participants in the financial sector.

DBS Group Holdings (DBS SP; S$9.15) – SELL

• Since hitting a low of S$6.42, DBS has rebounded strongly, overcame resistance after resistance. However, this rebound appears to be losing momentum. The stock is now trying to climb above the S$9.24 resistance again. The next resistance is at S$9.45-9.60.

• MACD’s upward momentum is slowing while its RSI is about to confirm a triple bearish divergence.

• Although the longer term charts have turned positive, the stock is likely to consolidate in the coming days. Take profit now with the next target at S$8.16 and S$7.83, its 38% and 50% Fibonacci retracement levels from a low of S$6.42 to a high of S$9.24.

DBS Group Holdings Limited and its subsidiaries provide a variety of financial services. The Company's services include mortgage financing, lease and hire purchase financing, nominee and trustee, funds management, corporate advisory and brokerage . DBS Group also acts as the primary dealer in Singapore government securities.

United Overseas Bank (UOB SP; S$11.04) – SELL

• Similar to DBS, UOB rebounded about 37.5% from a low of S$8.07 to a high of S$11.10. UOB is now testing its S$11.10 strong resistance level. The next resistance is at S$11.90-12.00.

• Traders may want to lock in some profits on any strong upward movement. Investors who missed out earlier may want to wait a while before getting in. This potential pullback to between S$9.94 (its 38% FR) and S$9.58 (50% FR).

• Very short term Indicators are now extremely overbought, which would likely lead the stock into a retracement phase in the coming days. The bearish divergence on its MACD Histogram further supports our bearish view in the short term.

United Overseas Bank Limited offers a full range of commercial banking and financial services. The Company offers private banking, trust services, venture capital investment, merchant banking, brokerage services, insurance, fund management, derivatives trading, precious metal trading, factoring, hire purchase, and life insurance

SP500 uptrend continuing


The S&P 500 closed lower on 14April09. The session prior to this closed near the open, indicating that momentum was neutral. By right, the lower close on 14April09 after a neutral day should indicate to us that short term momentum is turning down. The S&P 500 might retrace slightly. We would like to see a close below 832 to confirm that a retracement is in play. Closest support is at 814 then 804.

However, upside momentum for the S&P 500 and equities in general has been strong for this up move and our bias continues to lean towards the long side in favour of the trend. A close above 859 would indicate that the uptrend is continuing.

Straits Times Index Displaying Strong Momentum At an important juncture


STI has displayed exceptionally strong momentum, corrections have been milder than we anticipated and rallies sharper. We also notice that the correlation between the S&P 500 and STI is beginning to weaken. The STI continued to rally past 1900 today despite a lower close by the S&P 500 on 14April09. This might be due to a change in global investing sentiment that is shifting its focus to the emerging markets/Asia.

The STI closed at 1905 on 15April09, above resistance at the 1900 level. This indicates that the odds are in favour of the STI continuing higher. There is no resistance until 1950 to 1960.

The STI is approaching the 1950 to 1960 region rather quickly. This is a significant resistance zone and we are expecting a decent pull back and consolidation around this region before the uptrend continues. Investors might want to take some profits when the STI approaches this level.
As the STI rallied by more than 30% over the last 5 weeks, it has now reached an important juncture, the upper channel line of a 5.5-month near-horizontal price channel.

While a strong positive break out above the Jan ’09 high of 1960 could mean more medium term upside for the STI, a reversal could signal the start of another down-leg back to the lower channel line again.

With the technical indicators (RSI, MACD histogram, CCI and Momentum indicators) showing bearish divergence to the STI’s price action over the last 3 weeks, it seems to suggest that the current rally might not be sustainable.

Should the share price correct, we expect a pullback to the support level at around 1670 (minor trough in Mar ‘09), followed by 1457 (Mar ’09 low).

Any upside from the current level will likely meet resistance at around 2220 (Oct ’08 high), followed by 2600 (Sep ’08 high).

Wednesday, April 15, 2009

DBS - Bearish divergence suggest near term downside

With the emergence of a potential bearish harami and spinning top candlestick at the key resistance level of $9.13 (Jan ’09 downside gap zone and 4-month support-turned resistance line), buying interest in DBS seems to be waning, suggesting downside in the near term.

Indicators (RSI, MFI and MACD histogram) have at the same time indicated bearish divergence signals to the price action over the last 3 weeks, adding to the possibility of a correction in the days ahead.

Should the share price correct from here, we expect a pullback to the immediate support at around $8.78 (upside gap zone in early Apr ‘09), with the next support at $8.00 (upside gap zone, 50-day and 100-day MA).

Any upside from the current level will likely meet resistance at around $10.13 (downside gap zone in late Oct ’08 and 2009 high), followed by $11.04 (downside gap in mid Oct ‘08).

Chart of Sino-Env, Cosco, Asia Env, Biosensor, Chartered


Sino-Env=$0.20, called buy on 9 Apr at $0.155... reached yellowline at $0.205...take profit?


CoscoCorp=$1.05 (It will be positive if it can cross and stay above the yellowline....reinstate a buy


Asia Env=$0.13 Breakout?


Biosensors if breakout 200DMA.....


Chartered=$0.135 could challenge the $0.16 resistance