Friday, September 18, 2009

Singapore Strategy - Re-jigging top picks

Usual caution towards September unwarranted? Since late August, there has been a growing perception that equities have become overbought. Various strategists have sounded caution. Warning shots like the sell-down of the Chinese stock market last week plus noises about a new interest rate tightening cycle have emerged as new negatives by early September. This, coupled with September’s infamous track record for stock-market disappointments, added to the caution. All the above concerns are valid, though they have to be balanced by the sense that there seems to be still a tremendous amount of un-invested money on the sidelines. Trading into the second week of September, high-yield stocks like SPH, M1 and the REITs have outperformed, indicating a chase for yields and still-high levels of liquidity. Market price actions make us reconsider our defensive posture: one might miss the next rally if one stays defensive for too long.

Maintain Overweight on Singapore; CY09 index target remains 2,700. We leave our 2,700 year-end FSSTI target unchanged for now though it is useful to start thinking about final index target peaks. From our study, the FSSTI peaked at 2.3- 2.4x P/BV in the last two recovery cycles. Simplistically extrapolating such P/BV peaks would imply FSSTI targets of 3,900-4,000 at the end of this bull cycle. This might be a tad too bullish as prospects for bank, property and O&M earnings were much stronger two years ago. The FSSTI peaked above 2.0x P/BV only in periods of extreme exuberance (2000 tech boom and 2007 property boom). Assuming it does not reach 2.3-2.4x P/BV and eventually peaks at 2.0x P/BV, we see a target of 3,350 for next year, when we would turn bearish. Using a mean 16x P/E would also suggest a FSSTI target of 3,400.

Sector thoughts and top picks. From our list of top picks in August, we would take profit on CDL-HT and Ho Bee, replacing them with PLife REIT and Keppel Land. Other picks such as CityDev, Indofood Agri, Noble, SembCorp Industries, SPH, Suntec REIT and UOB remain. Additionally, CSE Global and Ezra have been added to our preferred list. Among the sectors, we suggest going long on property and short on banks. We prefer interest-rate-sensitive sectors to banks. Conglomerates stand out as a non-consensus Overweight, though the brighter prospects in the sector belong to second-tier names for now, we believe.

Sponsored Links

Thursday, September 17, 2009

Dry Bulk Shipping - Bi-weekly: BDI correction, near-term rebound

The BDI declined for 10 consecutive days due to weaker iron ore trade as well as seasonality, and it has already stabilised. We expected near-term rebound. Reiterate UNDERWEIGHT.

BDI’s correction due to seasonality. The Baltic Dry Index (BDI) declined by 18% over the past two weeks, mainly due to seasonality. Weak coal demand, quiet grain trade, and fewer chartered-in activities from Australian iron ore miners caused BDI to fall for 10 consecutive days. Rates stabilised later in the week ended 14 August.

Capesize. Fewer chartered-in activities from iron ore miners hence eased ports congestions in China, Brazil and Australia dragged down the Capesize rate. Average earnings fell by 2.5% wow to US$42,972/day.

Panamax. Panamax rate recorded a bigger decline than Capesize due to quiet grain exports from Latin America, weaker global demand for coal, and China’s decrease iron ore import from India. Average earnings fell by 0.6% wow to US$15,390/day.

Handymax/Handysize. Dragged down by Capesize and Panamax rates as well as fewer enquiries, average earnings of Handymax fell by 11.9% wow to US$17,625/day.

We expected a rebound in BDI in the near term after an 18% decline in two weeks. We see strong production of small steel mills in China and a global recovery in grains and other minor bulk trades helping the rates to rebound in the next two weeks. In the longer term, we maintain our conservative view with a BDI forecast of 2,500 for 2009 based on our 2009 steel production forecast of 514mt, considering steel inventories are building up and steel prices are showing signs of weakness.

Rise in iron ore stockpiles stops. The continuous rise in Chinese ports’ iron ore inventory was over. On 14 August, the inventory decreased by 1% to 74.55mt, from 75.29mt, still at a high level. Small- to mid-sized steel mills were rapidly resuming production while fewer chartered-in activities from iron ore miners caused the first two weeks of decline in iron ore inventories since the beginning of the year.

In our shipping sector’s 1H09 results preview, we raised the fair price of COSCO (1919.HK/SELL) and China Shipping Development (1138.HK/SELL) to HK$8.50 and HK$10.40, respectively, but maintain SELL rating. We also raised the fair price of Pacific Basin (2343.HK/SELL) and STX Pan Ocean (STX.SP/SELL) to HK$5.80 and S$11.00 respectively in the 2Q09 results update, and maintain SELL rating. We suggest selling expensive dry bulk stocks. COSCO is our top SELL.

Wednesday, September 16, 2009

Bukit Sembawang Estates - Downgrade on valuations


BukitSem, Outside bollinger band...sell. BS's share price has gained over 40% since our upgrade of the stock to Outperform in June. While inherent value remains considerable from its low-cost land bank, a lack of corporate access and relatively low trading volume are concerns. As uncertainties in the sector heighten on the back of cooling measures introduced by the government, we fear that BS will retreat into its shell as the launch window for the year starts to close. We recommend taking some money off the table until further evidence of improvements in the sector. We raise our FY10-12 core EPS estimates by 1.1% on minor adjustments to our launch schedules. We maintain our target price of S$5.02, still based on a 25% discount to our end-CY10 RNAV estimate to account for the shares' low trading liquidity and lack of corporate access. Downgrade from Outperform to Neutral on valuations.

Tuesday, September 15, 2009

Shangahi A Index rebound may end here


On 30 Aug, mentioned that Shangahi A Index at 2,789 could stage a rebound because 50% retracement will be a good support level. Now that it has rebounded to near 3,190 (yellowline)....chances for this rebound to continue is not very high. Expect Shanghai index to consolidate between 2,800-3,200.

Ramba potentially Technical Rebound?


Ramba =0.46 (potentially Technical Rebound)

Global Equity Technicals - One final leg

Our preferred wave count for the S&P500 shows that the index has peaked at 1,039 after the breakdown of its ST uptrend channel support at 1,014 last week. We also retain our downside target of 950, which is the major uptrend channel support. This week, we introduce an alternate wave count, which has a minimum target of 1,045-1,071, similar to our previous upside target. The alternate view would come into play should the 1,039 level be taken out for the S&P500. Asian markets are on course for a final upswing after holding steady above the key support trend line for MAxJ last week. However, the Shanghai Composite Index may have peaked for the medium term after a 5-wave decline from the high. The Shanghai index is currently on its wave-2 rebound to between 3,059 and 3,158.

Monday, September 14, 2009

CDL Hospitality Trust - Time for a breather

CDLHT's current share price of S$1.47 has exceeded its book value per share of S$1.42 while yields of 5.5% are lower than the REIT average of 8.2%. Even though Singapore's tourism indicators continue to improve and we have bullish above-consensus estimates for CDLHT, we believe most of the positives are in its share price and downgrade it to Neutral from Outperform. Our estimates and DDM-based target price of S$1.41 are unchanged. PLife REIT appears a cheaper and safe alternative at 0.8x P/V with forward yields of 6.8%.

Friday, September 11, 2009

Keppel - Bullish breakout suggests more upside potential

Likely more upside ahead. Keppel Corp (KepCorp) could see more upside potential in the days ahead after initiating a bullish breakout from its 1-month flag consolidation pattern on heavy volume yesterday. Incidentally, yesterday’s breakout also took place at its key $7.70 key support (key resistance-turned-support level and lower boundary of 6-month uptrend channel).

Positive signs from indicators. With the RSI rebounding off strongly from the 50% mark and the MACD indicator rebounding off the centerline and initiating a bullish crossover in the process, these seem to suggest a build-up in upside momentum.

Initial resistance zone at $8.45. We expect the stock to advance to the key resistance zone at $8.45 (2009 high), breaking which, the next resistance is at around $9.19 (minor peak in Sep ‘08).

Immediate support at $7.70. Beyond the $7.70 immediate support, we pegged the subsequent supports at $7.00 (resistanceturned- support) and $6.38 (minor troughs in Jun and Jul ‘09).

Note: We currently have a fundamental HOLD rating on KepCorp with $8.20 fair value.

Thursday, September 10, 2009

Oceanus time to take profit


Oceanus=$0.375 (Weighted Average=$0.377...outside bollinger band..time to take profit)

STI +2% over 2700


The continued optimism displayed by the US stocks overnight, coupled with a strong showing by the Nikkei in early morning trading is likely to inspire the STI to climb higher this morning.

We note that the last month's consolidation had resulted in the formation of a symmetrical triangle continuation pattern very similar to the one formed in early Jun'09 - mid Jul '09, which was subsequently followed by a strong bullish breakout to a new 2009 high of 2700. As such, any signs of a strong positive breakout in the days ahead could imply a similar outcome and propel the index towards the key support-turned-resistance level at 2740.

As before, we note that the technical indicators are starting to turn more positive, with the daily RSI rebounding strongly off the 50% mark and the daily MACD indicator on the verge of a bullish crossover.

On the upside, the immediate cap remains at 2681(50% retracement of 3906-1455 plunge), ahead of 2700 (psychological).

We continue to peg the initial support at around 2600 (mid Aug low); below this, the next strong support is at 2521 (mid Aug low).

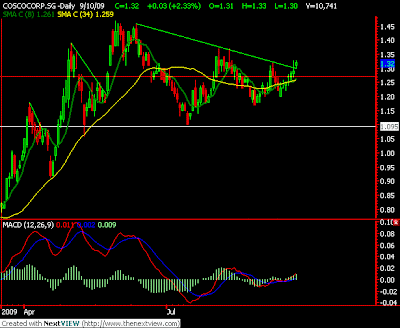
Cosco - Breakout Trendline resistance


CoscoCorp=$1.32 (Breakout Trendline resistance)

Wednesday, September 9, 2009

Epure - More upside potential on positive breakout

Key resistance breached. Epure could be poised for more upside in the weeks ahead after clearing the $0.620 key resistance on heavy volume yesterday; we see this as a significant break given the numerous failed attempts since Mar ’08.

Indicators turning bullish. With the RSI indicator rebounding strongly above the 50% mark and the MACD indicator initiating a bullish crossover yesterday, they support our view that the upside momentum is building up now.

Initial resistance at $0.705. The next resistance is at $0.705 (key support-turned-resistance level and upper boundary of 6-month uptrend channel), ahead of the $0.830 (peaks in Oct ‘07).

Immediate support at $0.620. Below the immediate $0.620 support, we peg the subsequent support at $0.565 (resistanceturned- support), followed by $0.465 (resistance-turned-support).

Oceanus Resistance at 0.355 tested


Oceanus=$0.355 (Resistance at 0.355 tested) MACD crossed over....

Tuesday, September 8, 2009

Dow, S&P500, Nasdaq still bullish

DJIA ? Heading for 2009 high (bullish)
S&P500 ? Heading for 1035 resistance (bullish)
NASDAQ ? Strong rebound at 6-month uptrend line (bullish)

Dow Jones Industrial Average (DJIA) ? Heading for 2009 high

Retesting 2009 high: The index could be heading back up to re-test the 9628 level (2009 high) in the days ahead after rebounding strongly last week.

Bearish divergences: However, with the RSI and MACD indicator still signaling a bearish divergence to the price action in the last 1 month, the 2009 high could prove too strong an obstacle to overcome.

S&P500 ? Heading for 1035 resistance

More upside in the days ahead: After breaking above the key 1000 level, we could see the index heading towards the 1035 resistance in the days ahead.

Warning signs from indicators: However, with both the RSI and MACD indicators showing bearish divergence to the price action currently, the index could potentially be heading for another significant correction if it fails to conquer the 1035 resistance.

NASDAQ ? Strong rebound at 6-month uptrend line

Heading for 2009 high: With the index rebounding strongly from the 6-month uptrend line, we could see further upside in the coming week towards the 2060 resistance (2009 high).

Beware of bearish divergence signals:With both the RSI and MACD indicator already showing bearish divergence to the price action, it pays to be cautious as the index look to re-test the 2009 in the days ahead.

Monday, September 7, 2009

Will Biosensors breakout?


Biosensors=0.60 (About to breakout?)

Asia Indices

Nikkei 225 ? Hovering at key support (bearish)
SSEC ? Strong support found (bullish)
HSI ? More upside potential (bullish)
KLCI ? Heading higher in the coming week (bullish)
STI ? Still range bounded in the coming week (bearish)

Shanghai Stock Exchange Composite (SSEC) ? Strong support found

More upside in the coming week: SSEC could be heading higher in the coming week after staging a strong rebound off its 10-month uptrend line.

Indicators show signs of a turnaround:With the RSI showing signs of a strong rebound and the MACD histogram showing a bullish divergence to the price action, this could mean further upside momentum for the index in the coming week.

Hang Seng Index (HSI) ? More upside potential

Signs of rebounding at key support:With the index showing signs of rebounding strongly at the 6-month uptrend line on heavy volume, this could mean further upside potential in the days ahead.

Technical indicators more bullish now:With the RSI rebounding for the 2nd time at the 40% mark and the MACD indicator turning around positively at the center line last week, they seem to suggest more upside momentum ahead.

Straits Times Index (STI) ? Still range bounded in the coming week

No clear direction yet: The index could carry on to trade range bounded in the coming week between the 2521 and 2700 levels. Until a break out occurs at either levels, the medium term direction could still be unclear.

Technical indicators more bearish:With both the RSI and MACD indicators still trending down, these suggest that the momentum is still more downside biased.

Friday, September 4, 2009

China Sky - further near-term gains limited


We issued a TA on China Sky on 26 Aug highlighting a positive breakout - and since then, the stock has rallied more than 37% within 7 sessions. But from here on, the stock may find it difficulty to clear our next key resistance level at $0.28.

With the daily RSI already hovering at the overbought region, further near-term gains could be limited.

We have raised our immediate support level up to S$0.25 (protective stop level) resistance-turned-support. Should a correction breach this support, it could mean further bearish implications thereafter.

However, should it take out the $0.28 resistance, it may still face another resistance at $0.295 (gap zone in Jan '09), followed by $0.33 (minor peak in Dec '08).

Singtel - Likely to move to higher end of $3.1 - 3.27 range

Trading interest has faded away in the past month following the stock’s failure to break recent $3.47-52 highs and sharp fall to below key historic $3.36-14 support area.

With rival index heavyweight stocks offering greater trading chances, ST languished, drifting to even below key historic $3.14 support ($3.10 low) but staying well above next $3.02-04 support.

As a result there had not been much positive technical signs to get trading ideas from as the counter fell well below its 13-day MA buy signal followed by periodic loss of 50-day MA support since mid-Aug.

However it managed to re-surface above 50-days after about a week of see-sawing, producing a mild rebound to $3.25 last week and $3.27 on Monday thanks to a cross between 13 and 50 days.

But this proved unsustainable as ST quickly plunged back to $3.14 at the day’s low and close and test of $3.11 in last 2 days with this morning’s low at $3.13.

Nevertheless, the MA cut is the first ray of hope that the stock could be coming out of its narrow consolidation and with the second quarter ending Sep 30 and analysts preparing to revise their forecasts, there should be some change of fortune soon.

First the stock will have to move back to the higher end of its $3.10- 27 range and this should be not too far away as the 13-days MA is flattening and showing signs of turning up for the first time since its downturn on Aug 5 which accompanied the plunge from $3.40 to $3.22, which demolished key historic supports from $3.36, $3.30 and $3.28.

Now it seems an uphill climb with $3.28 acting as first no-entry given that the Aug 31 high was $3.27.

But it should not be too difficult to break into $3.28-$3.36 as the 50- days (at $3.19) is still rising despite the past month’s weakness and with the potential for a more positive cut from a rising 13 (at $3.16) and 50-days, the counter should pull up back to this week’s high soon.

This should also bring it back to the rising trend channel which should be the case as nobody can argue that ST is destined to stay below this channel for more than a short spell of time.

Key fibonacci support and resistances are at $3.08 and $3.35, coinciding with the recent trading band and multi year figures with better chance of a move to a higher $3.14-$3.28 in coming days.

Thursday, September 3, 2009

Genting high price high volumn


Genting SP=1.14 (High Price and High Volume-278mln...making it a Toppish Signal)
Toppish means if you buy now you will get stucked at high prices.

MobileOne - Key breakout suggests more upside potential

Key resistance broken. MobileOne is likely to head higher in the days ahead; this after breaking above the $1.74 key support-turnedresistance on heavy volume yesterday.

Indicators are bullish. The RSI indicator has just rebounded strongly from the 50% mark and the MACD indicator is now on the verge of staging a bullish crossover. Coupled with a breakout from the Bollinger Band squeeze yesterday, these signals suggest further upside momentum ahead.

Initial resistance at $1.85. We peg the immediate resistance at $1.85 (gap formed in Oct‘09), ahead of the $1.92 (peak in Sep’09 and gap formed in Aug’09).

Immediate support at $1.74. Below the immediate support of $1.74, we peg the subsequent support at $1.65 (key resistanceturned- support), followed by $1.58 (resistance-turned-support and 9-month uptrend line).

Wednesday, September 2, 2009

STI - wait for the gap be filled


Straits Times Index, lets waiting the gap 2483 - 2503 to be filled

Tuesday, September 1, 2009

Watch For Break of Major Trendline in STI


In the above chart of the STI daily, we can see a very clear trendline that can be drawn from the beginning of the late March09/ early April09 rally.

This trendline is that it links all the major swing lows of the entire run up, including the recent pullback to the 2520 region. We can observe that there has not been a single trendline violation since the beginning of this run up.

The significance of this is that (1) it should act as interim support for the STI and (2) should this trend line be broken, it would turn into heavy upside resistance.

The high and low of the range is delineated by the week ending 7August09, when the STI sold off from the 2700 mark. Not including this week, the STI has been trading within the high/low range of the week ending 7August09 for the past 3 weeks.

The low (2542) and high (2700) of the range are the key support and resistance zones respectively. Typically, a consolidation range as such is a prime candidate for breakouts. Volatility in the market moves in cycles, and usually periods of low volatility (past 3 weeks) beget periods of high volatility.

In the chart above, we have delineated 2 scenarios for the STI. One for an upside breakout and another breakout to the downside. What we are looking for is for the STI to trade past key support (2542) or resistance (2700) and come back to test it again before pushing off.

For example, a break below key support at 2542 turns key support into key resistance. A second rejection of 2542 would usually be a high probability indication that the STI would be pushing lower. The reverse holds true should the STI trade to the upside beyond 2700 as well. In the interim, last week’s low, 2574, should hold up as shorter term support.

Z-Obee time to take profit


Z-Obee=0.15 (Breaking out and SAR at $0.15, take profit now)